API Security
Cloud architectures have led to a proliferation of microservices. APIs are the means to enable interaction between those microservices—whether within the same app, or between applications.
The APIs you expose (internally and externally), as well as third-party APIs your applications consume, may entail security risks, making API security a top priority. Panoptica automatically builds a catalog of your APIs, analyzes risks associated with them, assigns risk score, and helps maintain your security posture.
Securing APIs with Panoptica
Panoptica helps keep your APIs secure in a number of ways:
- API Discovery provides visibility by automatically building inventories of three types of APIs, which are displayed in the API Assets table:
- Internal APIs - An inventory generated by internal API traffic, between workloads and/or VMs in your environment.
- Externally Exposed APIs - A list of internal APIs that are reachable from outside of your domain. These APIs are exposed through an ingress, such as an API Gateway.
- Third-Party APIs - An inventory of the APIs consumed by workloads in your cluster, and hosted by third-parties outside of your domain.
- Security Insights assesses the security risks associated with your APIs, and displays them in the Findings table. These findings are based on:
- Spec Analysis
- 3rd party API Scoring
- Continuous API Trace analysis
- By automating the detection of Sensitive Data in your APIs, Panoptica helps streamline your data protection processes, reducing the risk of data breaches and ensuring compliance with standardized regulations.
API discovery and the API security features need to observe real API traffic. To achieve this, make sure to complete both elements of API Security onboarding: first deploy the API Security Controller in your cluster; then install a plugin in your API gateway, to attach Trace Sources.
View APIs
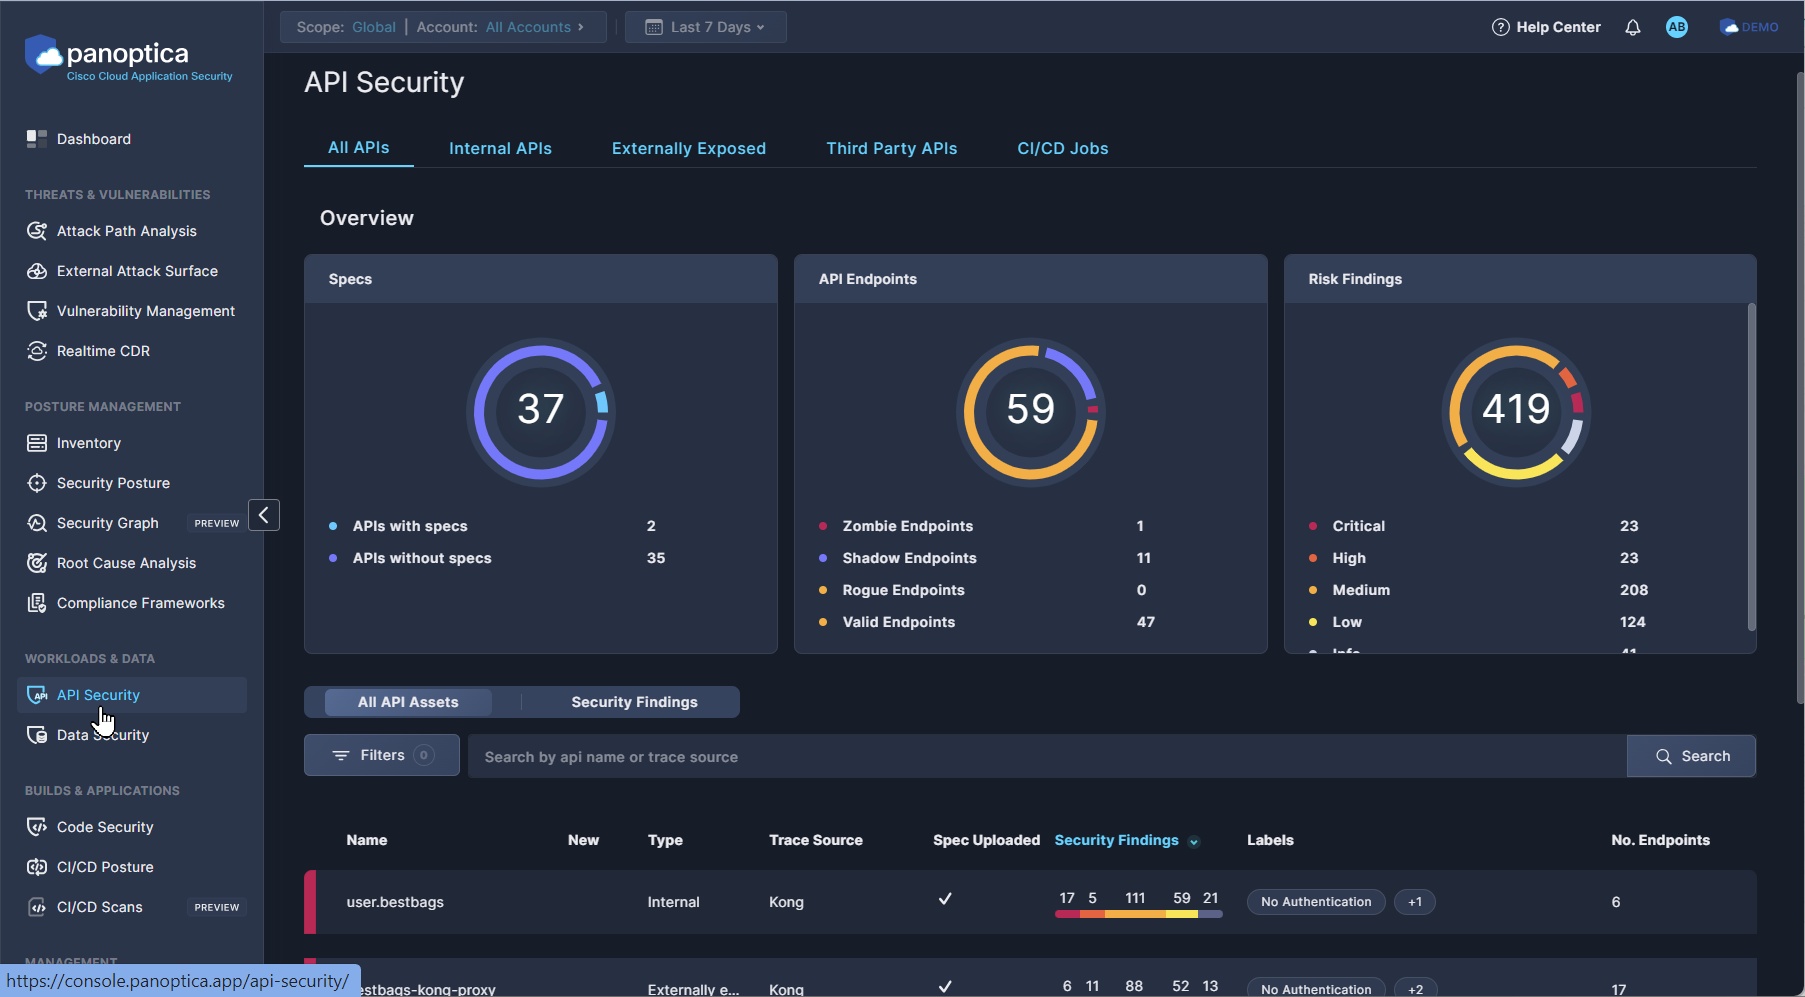
In the Panoptica console, navigate to the API Security tab under Workloads & Data to view the APIs that Panoptica is monitoring.

The default view displays All APIs that have been discovered by Panoptica, or manually onboarded.
Select one of the other sub-tabs – Internal APIs, Externally Exposed, or Third-party APIs – to filter the results according one of those subsets.
Widgets
The three widgets at the top of the API Security page provide a snapshot of the API security findings.
- The Specs pie chart indicates the number of APIs, and how many of them have an OpenAPI Specification (OAS) associated with them.
- The API Endpoints widget displays the number of endpoints found in all of your APIs.
- The Risk Findings pie chart provides graphical representation of the security risks assessed in your APIs. The five colors of the graph indicate the risk severity, from Critical (red) to Informational (gray). The total sum of risk findings appears in the middle.
The table below the widgets presents the API findings in two ways:
- All API Assets lists the APIs that have been discovered by Panoptica, or manually added, with summary data about each asset.
- Security Findings lists the risks and vulnerabilities Panoptica has identified, with summary data about the assets affected by this risk.
All API Assets
The default All API Assets view lists all of the APIs that have been discovered in your environment. You can customize this view in several ways:
- Click the Filter button to narrow the list according to three parameters:
- Trace Source Type
- Highlight risk findings: Critical to Informational
- Labels: Sensitive Data, No Authentication
- Type the API name into the Search bar to find specific resources.
- At the bottom of the screen you can define how many items are displayed on a page, from 5 to 100 lines.
The table displays summary data about each API, including its type, its trace source, a graphical representation of the security findings, any labels the API may have, and the number of endpoints.
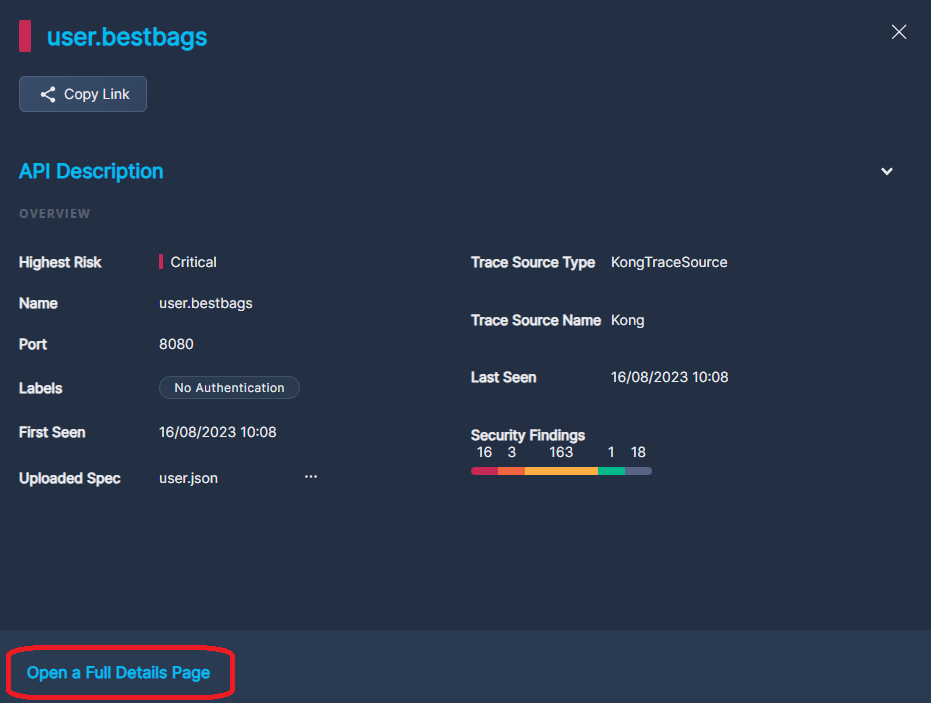
Click on any row in the table to pop up a side window that displays additional information about that API, including port, uploaded specs, and when it was observed.

If there is no OpenAPI Specification, click the three dots (•••) to the right of Uploaded Spec to add one.
If there is already an OpenAPI Specification uploaded, click the three dots (•••) to replace it, delete it, or view it in Swagger.

Click Open a Full Details Page at the bottom of the window to reveal even more information about the API you have selected. See API Asset Details for help navigating the full details page.
Security Findings
Panoptica evaluates the security risks associated with APIs in your environment, and assigns risk scores. These include your own APIs, as well as third-party APIs that you are using. This evaluation is based on spec analysis, trace analysis, and external ranking services.
Click the Security Findings button to view the risks and vulnerabilities Panoptica has identified in your APIs, with summary data about the assets affected by this risk.
- Click the Filter button to narrow the list according to four parameters:
- Risk: Critical to Informational
- Category: Application, API Spec, Authentication, Authorization, Network, System
- Source: Third Party Scorer, OAS Analyzer, or Trace Analyzer
- Detected findings only: Yes or No
- Type a term from a risk name into the Search bar to find specific resources.
- At the bottom of the screen you can define how many items are displayed on a page, from 5 to 100 lines.
The table displays summary data about each risk identified, including the number of affected elements, the source, and a brief description of the risk.
Click on any row in the table to pop up a side window that displays additional information about that risk.
- Under Risk Overview, you'll find a more detailed description of the risk cause, as well as a severity ranking and any categories this risk might fall into.
- Expand Occurrences to find details of every incidence of this finding across your environment.
- Under Affected Elements you'll find all of the APIs where this risk is present.
Updated 8 months ago
