CLI Job Results in the Console UI
When you download Panoptica's API Security CLI to "shift left" your API security, you are able to detect risks earlier in the CI/CD pipeline. The results of those jobs – in both summary and detailed form – are reported in the CLI. To make the results more accessible, and trackable, you can also view them in the Panoptica console UI.
View CI/CD Jobs
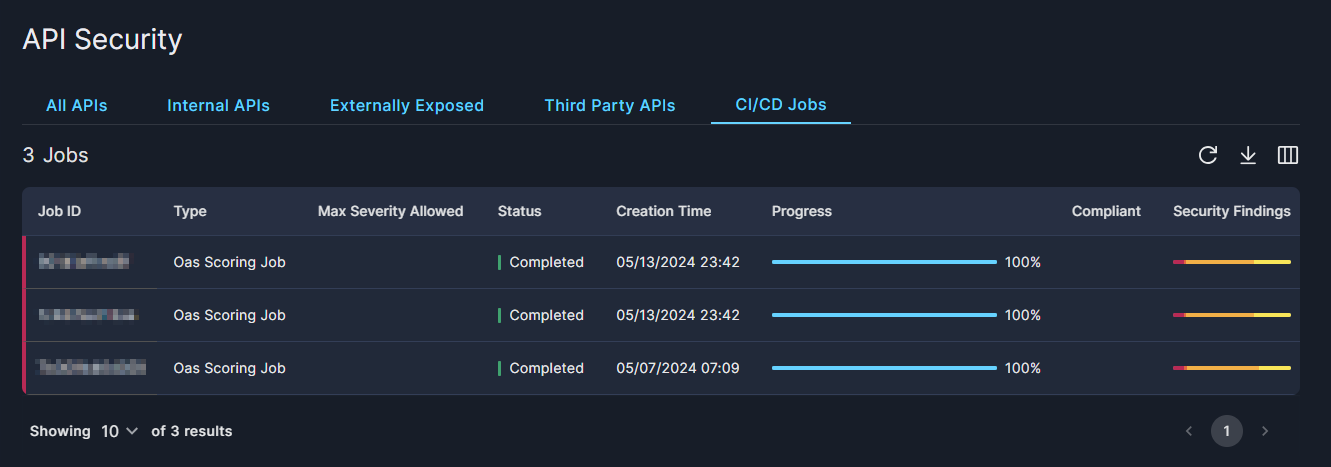
In the Panoptica console, navigate to the API Security tab under Workloads & Data. Click on the CI/CD Jobs subtab to view a list of all the jobs that have been run via the API Security CLI.

The table on the CI/CD Jobs tab displays summary data about the jobs that have been run in the past 60 days:
- Job ID – assigned when the job is created
- Type – Spec Analysis Job, OAS Scoring Job, or Fuzzing Job
- Max Severity Allowed – a setting to indicate whether the job is compliant or not
- Options are Critical, High, Medium, Low, Information
- Status – Completed or Failed
- Creation Time
- Progress – 0 to 100%
- Compliant – whether the job passed or failed the Max Severity Allowed setting.
- Security Findings – bar chart representing security status.
You'll find a few icons in the upper right corner of the table for managing the list:
- Click the circle-arrow icon (↻) to Reload the table, without the need to refresh the whole page.
- Click the down arrow (↓) to Download the list of assets in JSON or CSV format.
- Select which columns are displayed, and in which order, by clicking the Arrange Columns button (▥).
At the bottom of the screen you can configure how many records are displayed on each page, from 5 to 20 lines.
CI/CD Job Overview
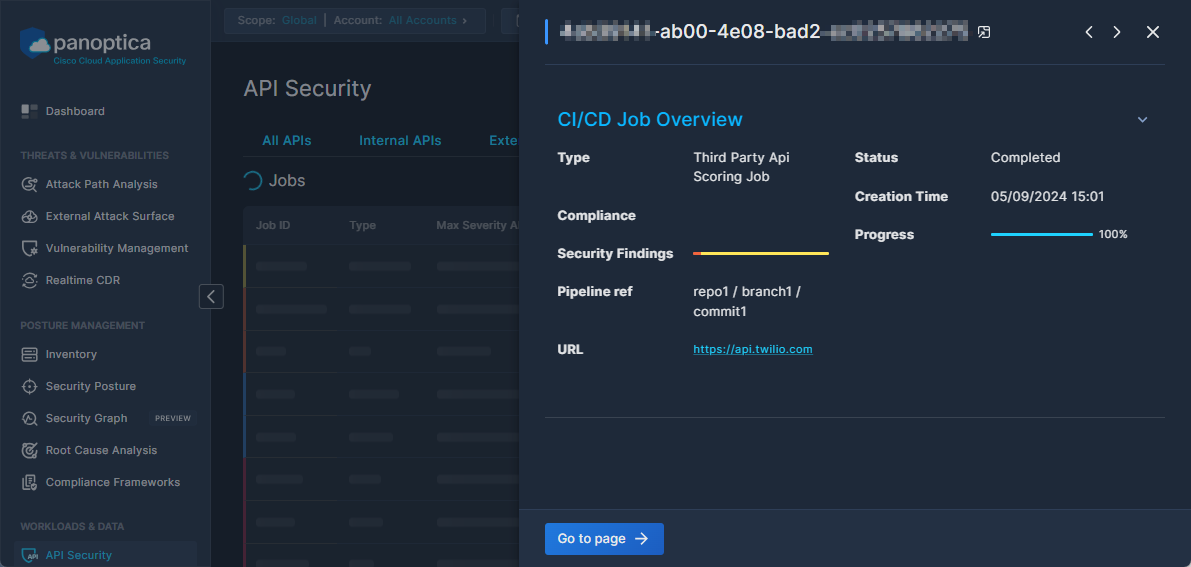
Click on any row in the list of CI/CD jobs to pop up additional information in a side "drawer".

Click Open in a new tab beside the Job ID to view all of the security findings in a detailed view.
The drawer displays most of the same information as appears in the jobs table, in addition to specific details related to the job type.
- For Third Party API Scoring Jobs, the Job Overview includes the URL of the API.
- For Fuzzing Jobs, the Job Overview includes the swagger URL, as well as the fuzzing depth.
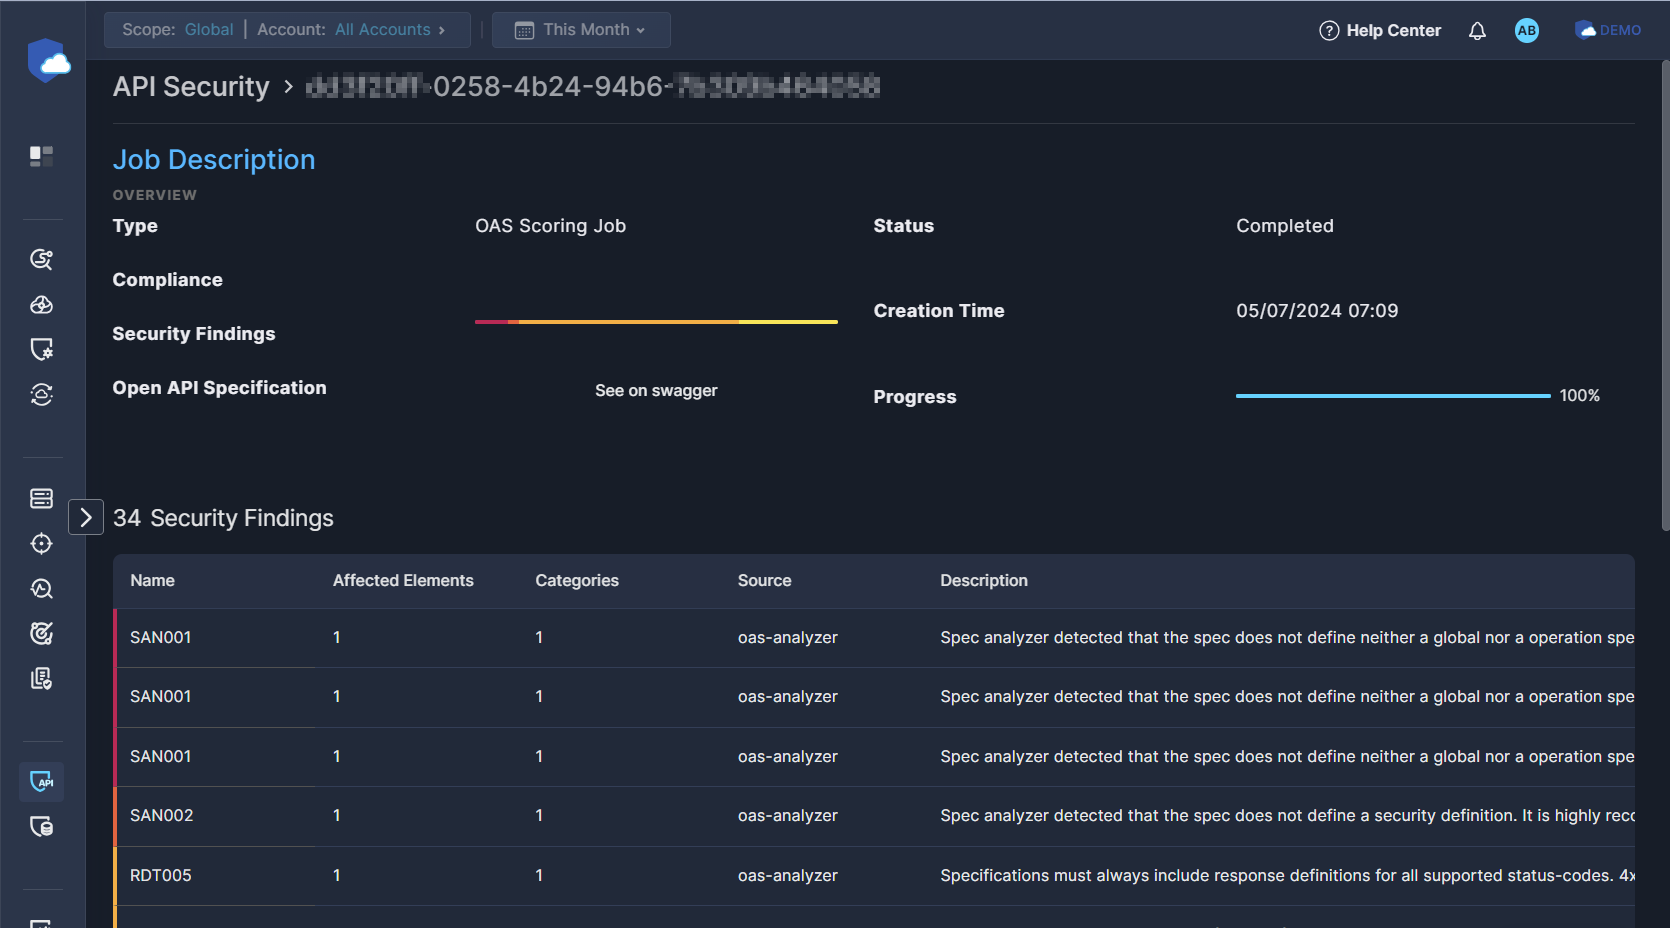
- For OAS Scoring Jobs, the Job Overview includes a link to view the spec in swagger.
Click Go to page to view detailed results of the selected job,
Security Findings
In addition to the summary information that appeared in the side drawer, the full page view includes all of the Security Findings discovered by the selected CLI job.
The Security Findings table displays the names of the findings, and a brief description of each. The color patch in the left margin of the table indicates the findings' severity, from red (Critical) to blue (Information).

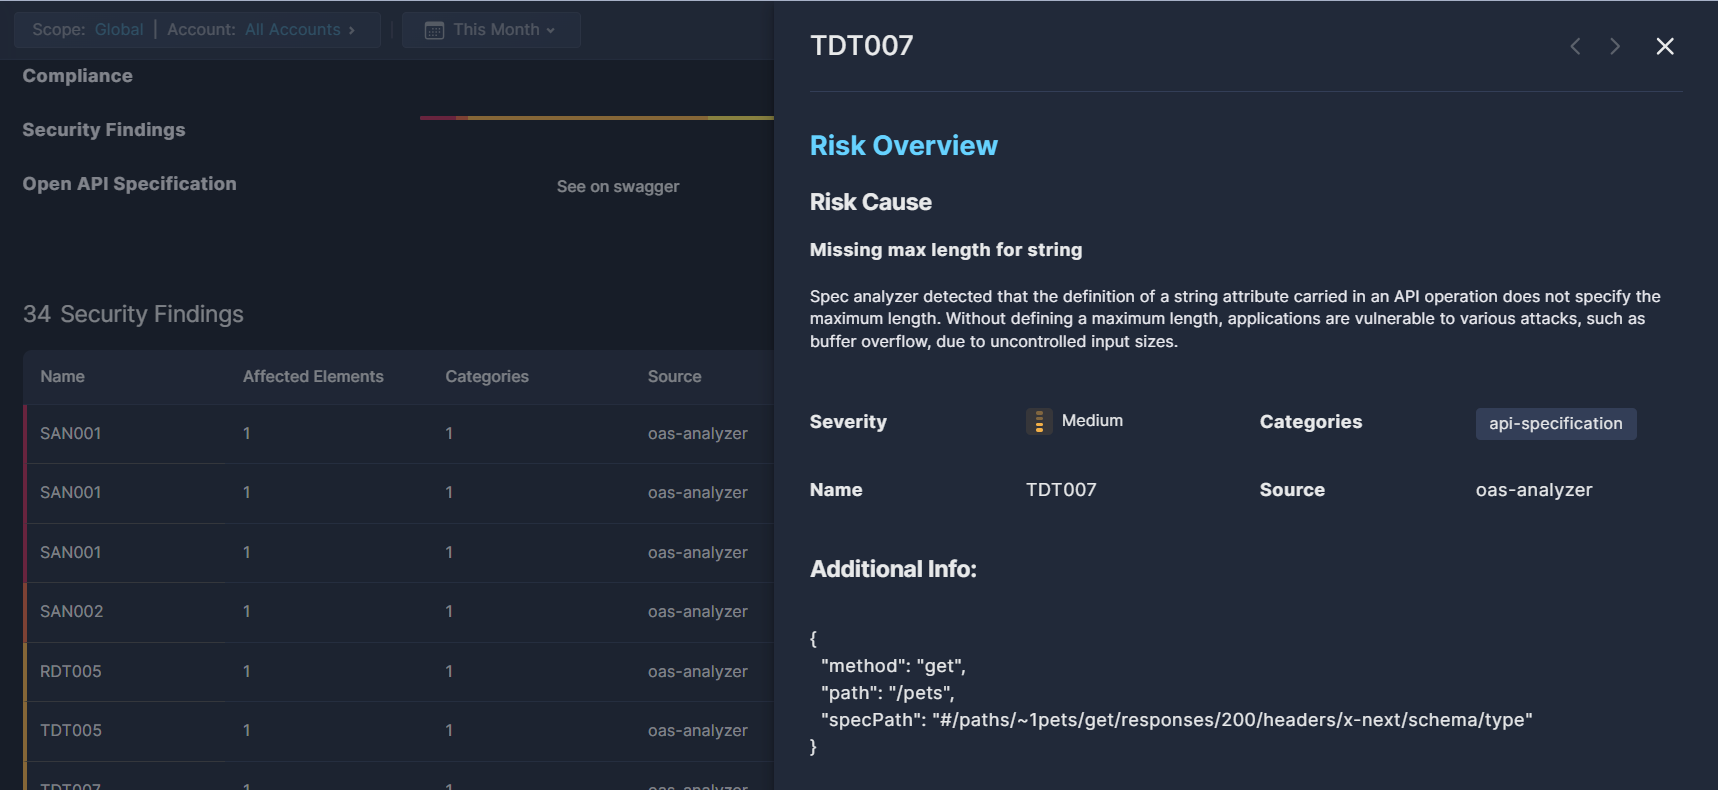
Click any row in the Security Findings table to open another side drawer, with additional about that finding.
- Review the detailed description of the Risk Cause to gain a better understanding of the issue.
- Under Additional Info, you'll find the attributes of this particular instance of the security finding.

Updated 8 months ago
