Realtime K8s Workloads
The Realtime K8s Workloads tab presents a dashboard-to-detail view of your Kubernetes inventory in real time. In addition to gaining aggregate insights, you can filter the results by a number of parameters, customize your search, and drill down to explore detailed information about the applications and services deployed in your Kubernetes clusters.
To reach the K8s Workloads tab, browse to the Inventory tab under Posture Management in the Panoptica console UI, and select the K8s Workload subtab.
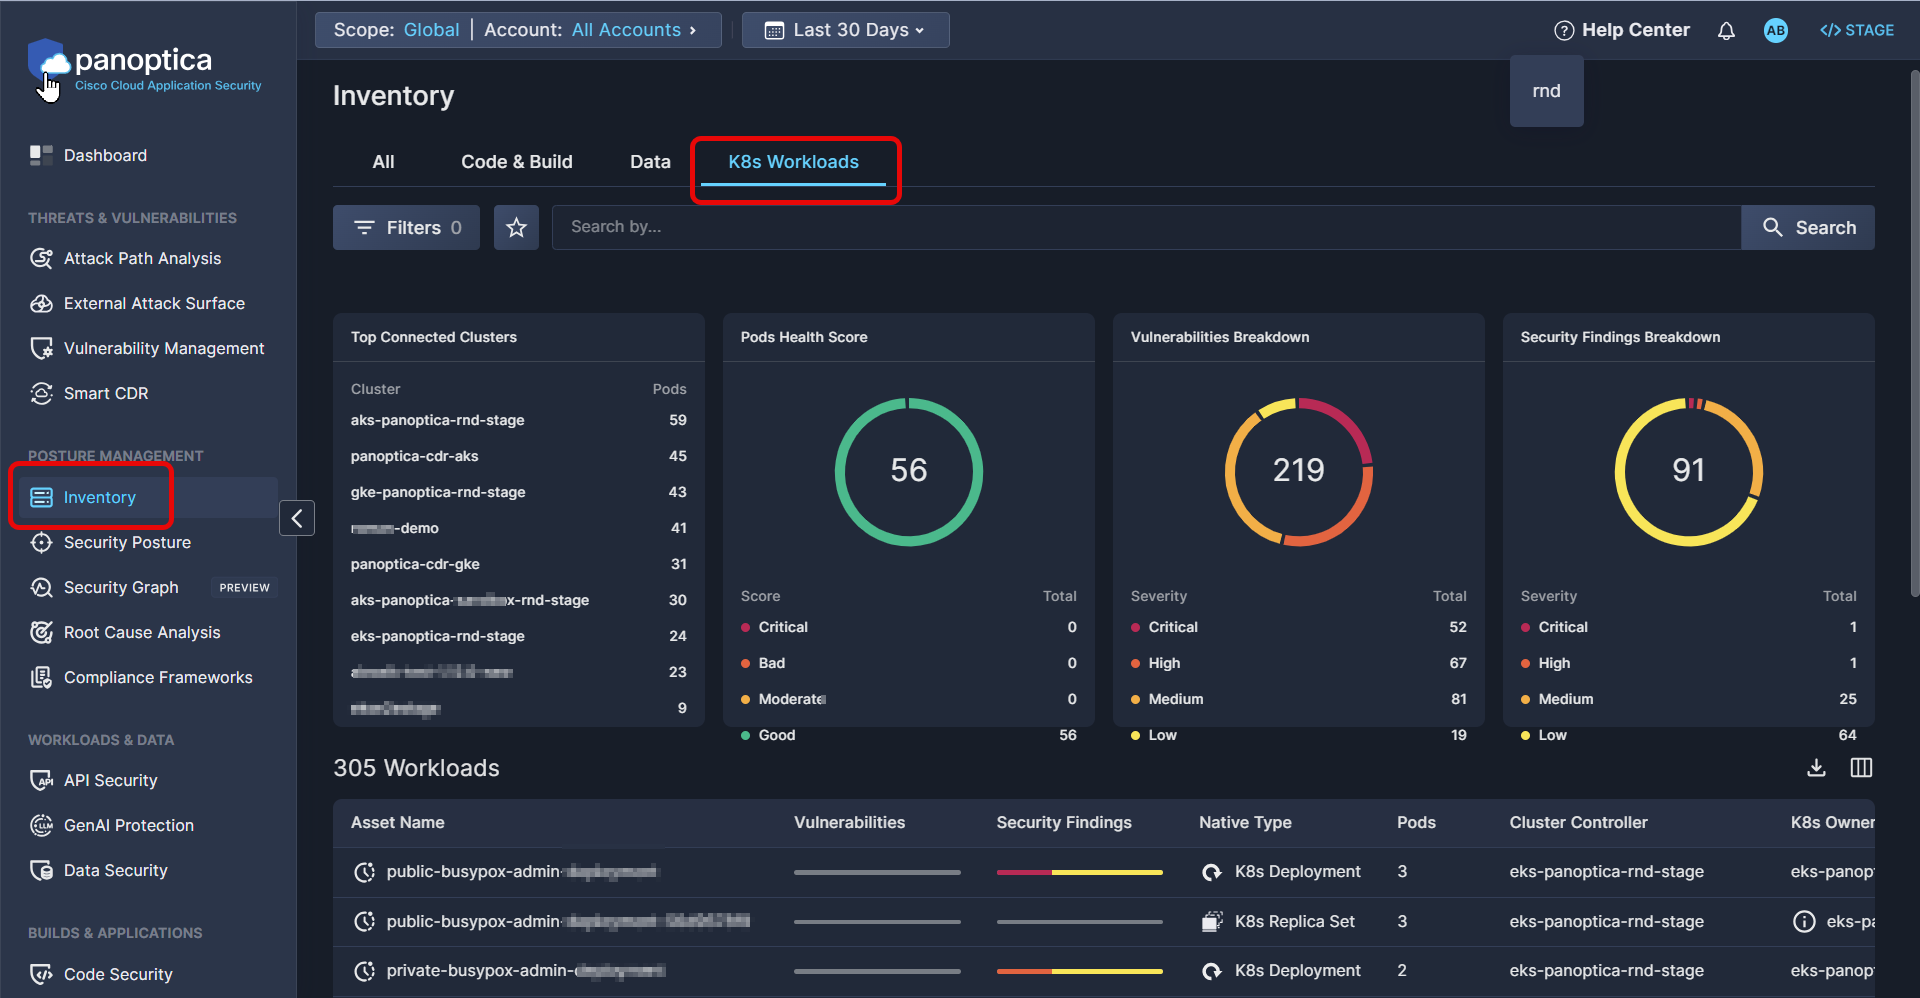
K8s Workloads Tab
Filter and Search
Use the Top Bar Filter to narrow down the findings across the platform by Scope and Account using the drop-down lists at the top. You can also select the time frame during which the asset was last observed.

Top Bar Filter
You can further refine the results using predefined filters and open search.
- Use the drop-down Filters list to narrow the results by: Provider, Account Name, Service Category, Native Type, Health Level, Labels, Security Insights, Sensitivity Level, Favorites, Ignore, Known Admin, Realtime, Security Findings Severity, Vulnerabilities Severity, Top Level.
- Use the Search bar to look for a text string in an Asset Name, Cluster Controller, K8s Owner, or Namespace. To clear the search, click the ×.
K8s Widgets
The K8s Workload dashboard displays four widgets that provide snapshot insights into the workloads in your environment.
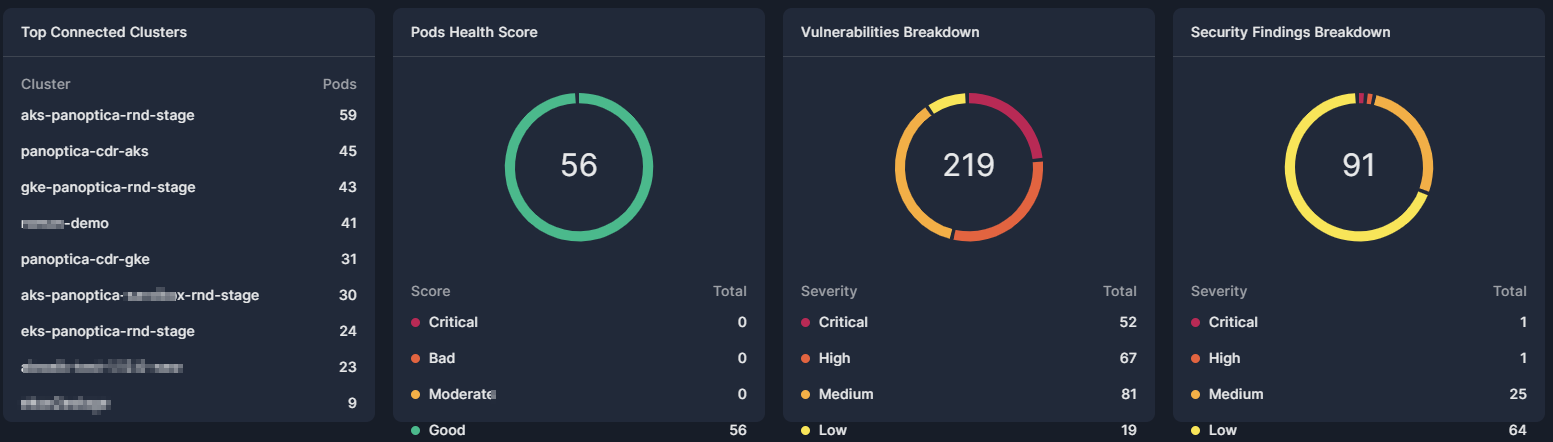
K8s Widgets
Top Connected Clusters: A list of the connected clusters, and the number of pods in each cluster. Click on a cluster name to filter the findings for that cluster.
Pods Health Score: A pie graph indicating the health of the pods in your environment, broken down by score: Critical, Bad, Moderate, or Good. See Asset Health Score for details about how Panoptica calculates the health score.
Vulnerabilities Breakdown: A pie graph indicating the vulnerabilities found in your environment, broken down by severity: Critical, High, Medium, or Low. Click on a severity level to filter the findings by that level.
Security Findings Breakdown: A pie graph indicating the security findings discovered in your environment, broken down by severity: Critical, High, Medium, or Low. Click on a severity level to filter the findings by that level.
Workloads Table
Below the widgets, Panoptica lists all the workloads discovered in your environment, displayed according to the filters and search parameters you defined.
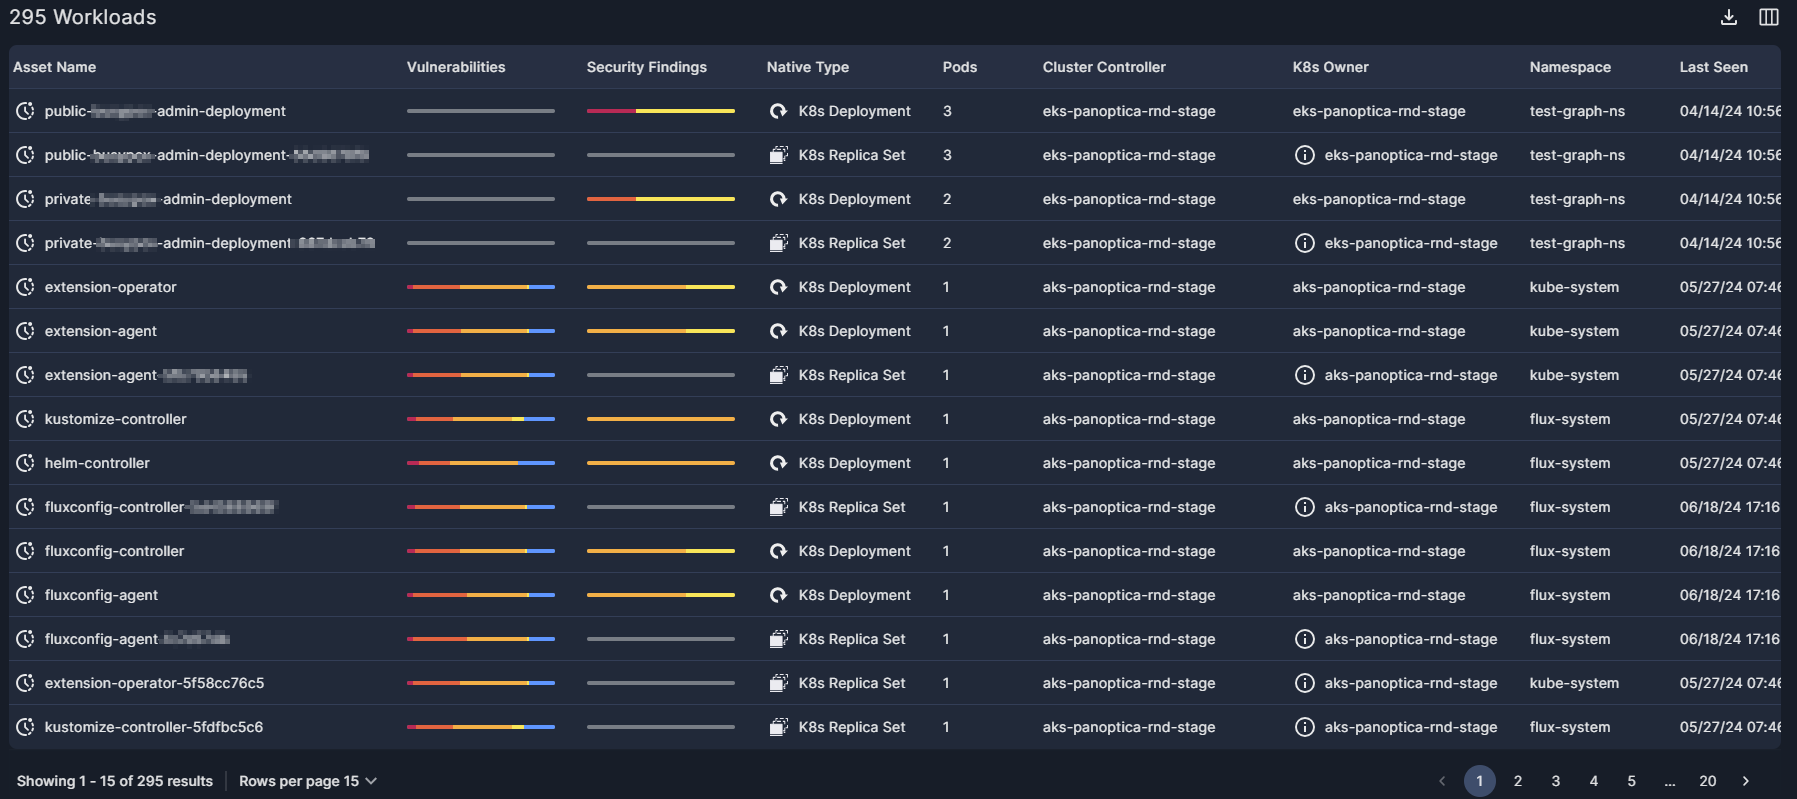
Workloads Table
The Workloads table provides summary data about your workloads:
Asset Name: name of the workload. The Realtime Icon that appears beside the asset name indicates that the data presented is current.
Vulnerabilities: a bar graph indicating the vulnerabilities found in this workload, broken down by severity: Critical, High, Medium, or Low.
Security Findings: a bar graph indicating the security findings discovered in this workload, broken down by severity: Critical, High, Medium, or Low.
Native Type: the type of deployment: K8s Deployment, K8s Replica Set, K8s Daemon Set, K8s Stateful Set, or K8s Pod.
Pods: the number of pods in this workload.
Cluster Controller: the name of the account.
K8s Owner: the entity responsible for this workload. When the workload spec has drifted from the parent configuration, an information icon appears with a tooltip indicating the change.
Namespace: the namespace where the workload is located.
Last Seen: when the workload was most recently observed in your environment.
The Workloads table can be sorted according to most of its columns by clicking on the column header.
Click the down arrow (↓) in the upper right corner of the table to Download the list of assets in JSON or CSV format.
Select which columns are displayed, and in which order, by clicking the Arrange Columns button (▥).
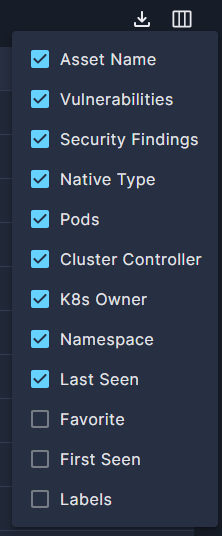
Arrange Columns
You will find here three additional columns that are not displayed by default:
Favorite: any workloads you have tagged as Favorite.
First Seen: the first time a workload was observed in your environment.
Labels: any labels you have added to the workload.
At the bottom of the screen you can configure how many records are displayed on each page.
Workload Details
Click on any row in the list of workloads to pop up additional information in a side drawer.
Workload Details
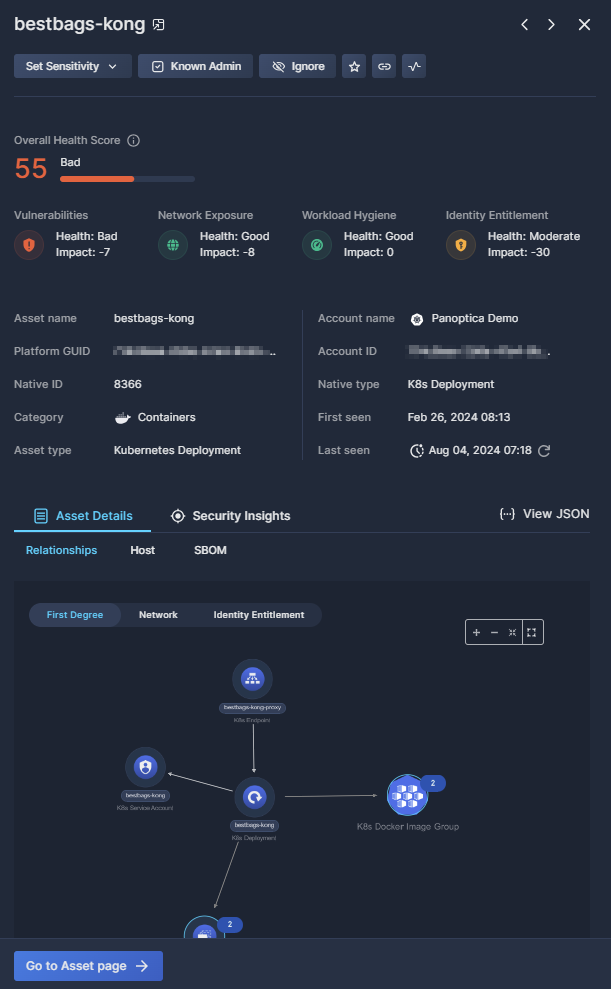
Use the buttons at the top of the pop-up window to take specific actions on the selected workload:
- Click Set Sensitivity to select the sensitivity level, in order to prioritize any higher severity alerts on it. See Sensitivity Levels on the Data Type Classification page for details.
- Mark an asset as a Known Admin to ignore high privilege alerts on it. You can add a comment when confirming this status, for future reference.
- Select Ignore to dismiss any alerts found on it. You can add a comment when confirming this status too, for future reference.
- Click Add to Favorites to, well, add to favorites.
- Click Copy link to retrieve a URL of the full asset page. This is useful for record keeping or sharing this information with others.
The Overall Health Score helps you visualize the health of this workload, presented on a scale from 0 to 100, where lower scores indicate potential security issues. The score is comprised of four aspects that impact an asset's security: Vulnerabilities, Network Exposure, Workload Hygiene, and Identity Entitlement. See Asset Health Score for more information on asset health.
Below the Overall Health Score, the side drawer displays more details than those shown in the Workloads Table, including Platform GUID, Account ID, Native ID, and more.
Asset Details
The Asset Details tab below enables you to drill down even further into the asset's properties.
-
The Relationships subtab displays a graphical view of related assets, network architecture, and identity enablement.
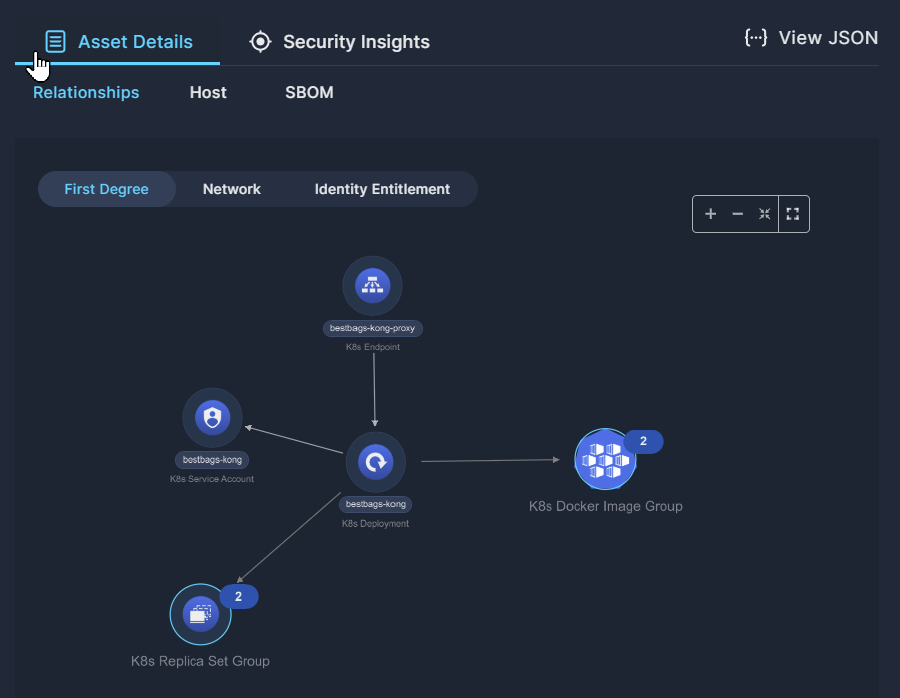
Asset Details
-
The Host subtab provides details regarding the operating system and hardware architecture of the host environment, if relevant.
-
The SBOM subtab lists the libraries that make up the software bill of materials, if relevant.
Click View JSON to download the Asset Details in a JSON file.
Security Insights
The Security Insights tab provides an asset-centric view of the Attack Paths, Vulnerabilities, and Posture Risks associated with this asset.
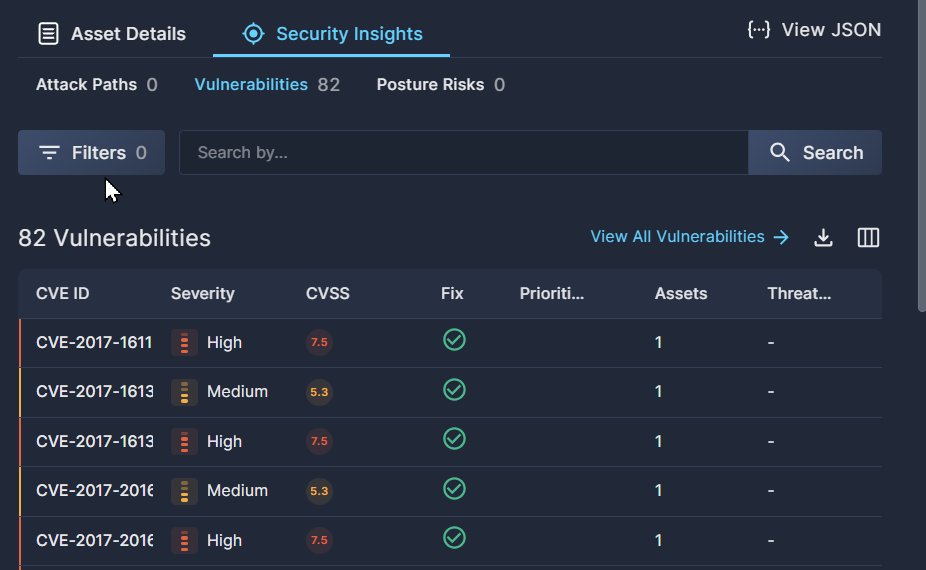
Security Insights
- An Attack Path is the flow of interconnected assets, accounts, identities, and/or permissions that an attacker can use to exploit a cloud environment. This subtab shows any attack paths where this workload plays a part. Learn more about this subtab at Attack Path Analysis.
- The Vulnerabilities subtab lists any Common Vulnerabilities and Exposures (CVEs) that have been identified in this workload. Learn more about this subtab at Vulnerability Management.
- The Posture Risks subtab lists any security findings discovered in this workload. Learn more about this subtab at Security Posture
Click Go to Asset page to view these same details in a full-page view, much like the Copy Link button above.
Updated 8 months ago