Data Security
Securing your cloud environment is about more than just detecting suspicious behavior and identifying misconfigurations. Data is at the heart of everything your organization does, so keeping it safe − especially your sensitive data − is critical to maintaining your security posture.
Panoptica's Data Security Posture Management (DSPM) safeguards your data across the entire cloud-native application lifecycle, from development to production. It does this by enabling you to monitor critical data exposures via managed and unmanaged services; providing continuous visibility into data assets; presenting actionable risk findings; and ensuring alignment with a number of key compliance frameworks.
Data assets can be either managed services, such as database services in cloud providers, or unmanaged applications, that are installed and administered by the end user. Panoptica scans your cloud inventory for any sort of data − including "shadow" repositories in backups and replicas − and presents it in the Data Assets dashboard. For a list of the managed and unmanaged assets Panoptica supports, see List of Supported Data Assets.
File size limit
Panoptica can scan files up to 10 MB in size
There are three elements that make up Panoptica's data discovery process:
- Discover data stores across managed cloud services
- Discover unmanaged datastores running on Kubernetes clusters or cloud workloads
- Categorize the data stores into different types - e.g. database, storage bucket, data analytics, file sharing
After discovering data stores across your organization's environment, Panoptica scans the structure and content to analyze the data for potential exposures and vulnerabilities. The Data Security Posture Findings dashboard provides visibility into security issues such as publicly accessible assets, weak security or encryption, misconfiguration, or vulnerabilities. Panoptica also assesses governance compliance, such as excessive permissions, unauthorized access, inactive identities or API keys, and more.
Data Security Dashboard
The Data Security Dashboard provides a snapshot view of the data assets Panoptica has discovered across your environment, as well as insights into any risk exposures related to those assets. Go to Data Security under Workloads & Data in the main navigation pane to start exploring and understanding your Data Security posture.
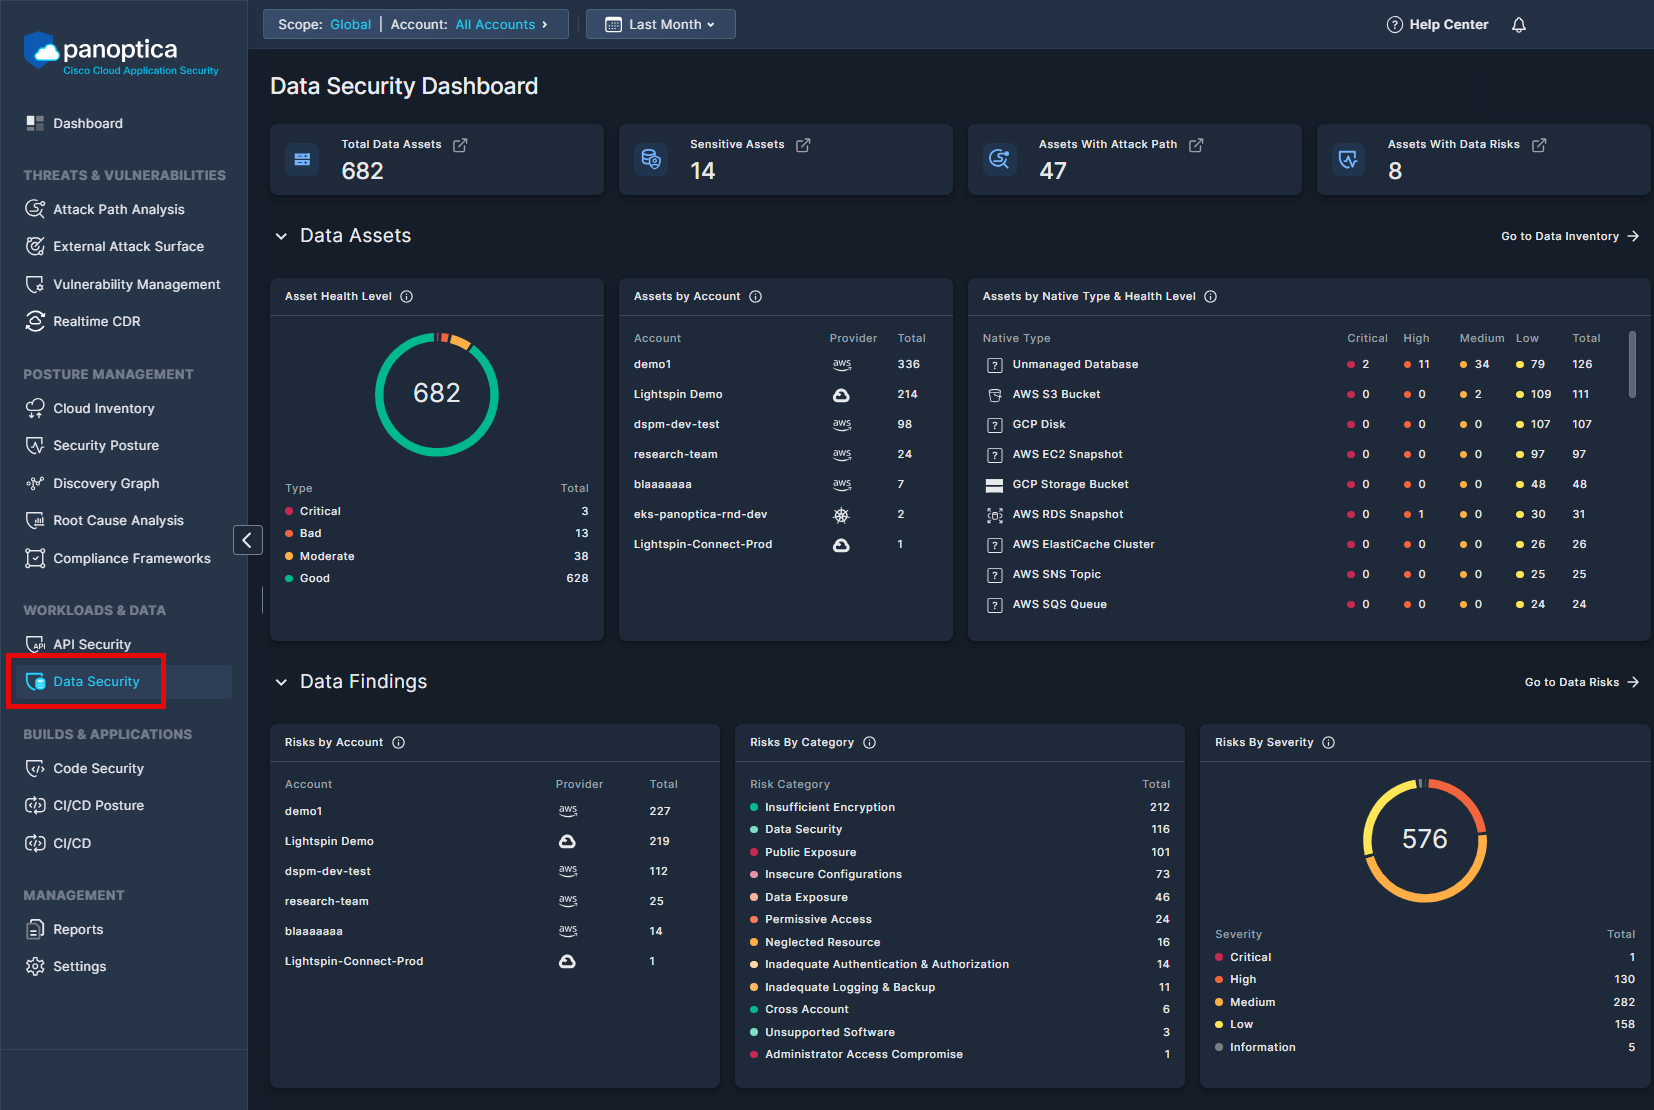
Filters
Use the global Top Bar Filter to narrow down the findings by Scope and/or Account, using the drop-down lists at the top of the screen. You can also select the time frame during which the data findings were last seen, form 24 hours to last month.

Summary Widgets
Across the top of the Data Security Dashboard, you will find four widgets that provide summary data of the assets and risks Panoptica has discovered in your environment.
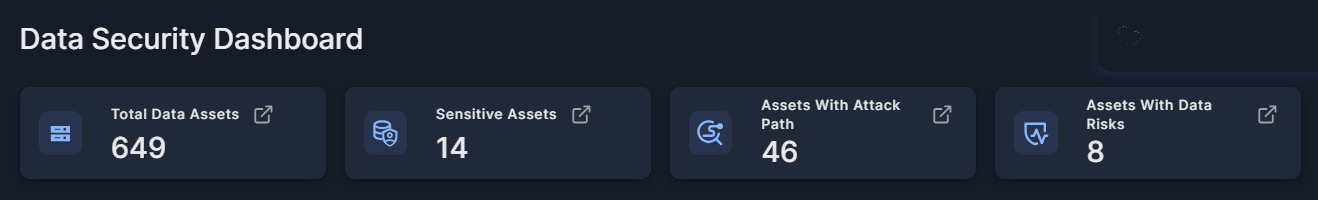
- Total Data Assets
- Sensitive Assets
- Assets With Attack Path
- Assets With Data Risks
Data Asset Discovery
The Data Assets dashboard displays widgets that provide snapshot views of the assets discovered in your environment, according to health level, account name, data type, and more.
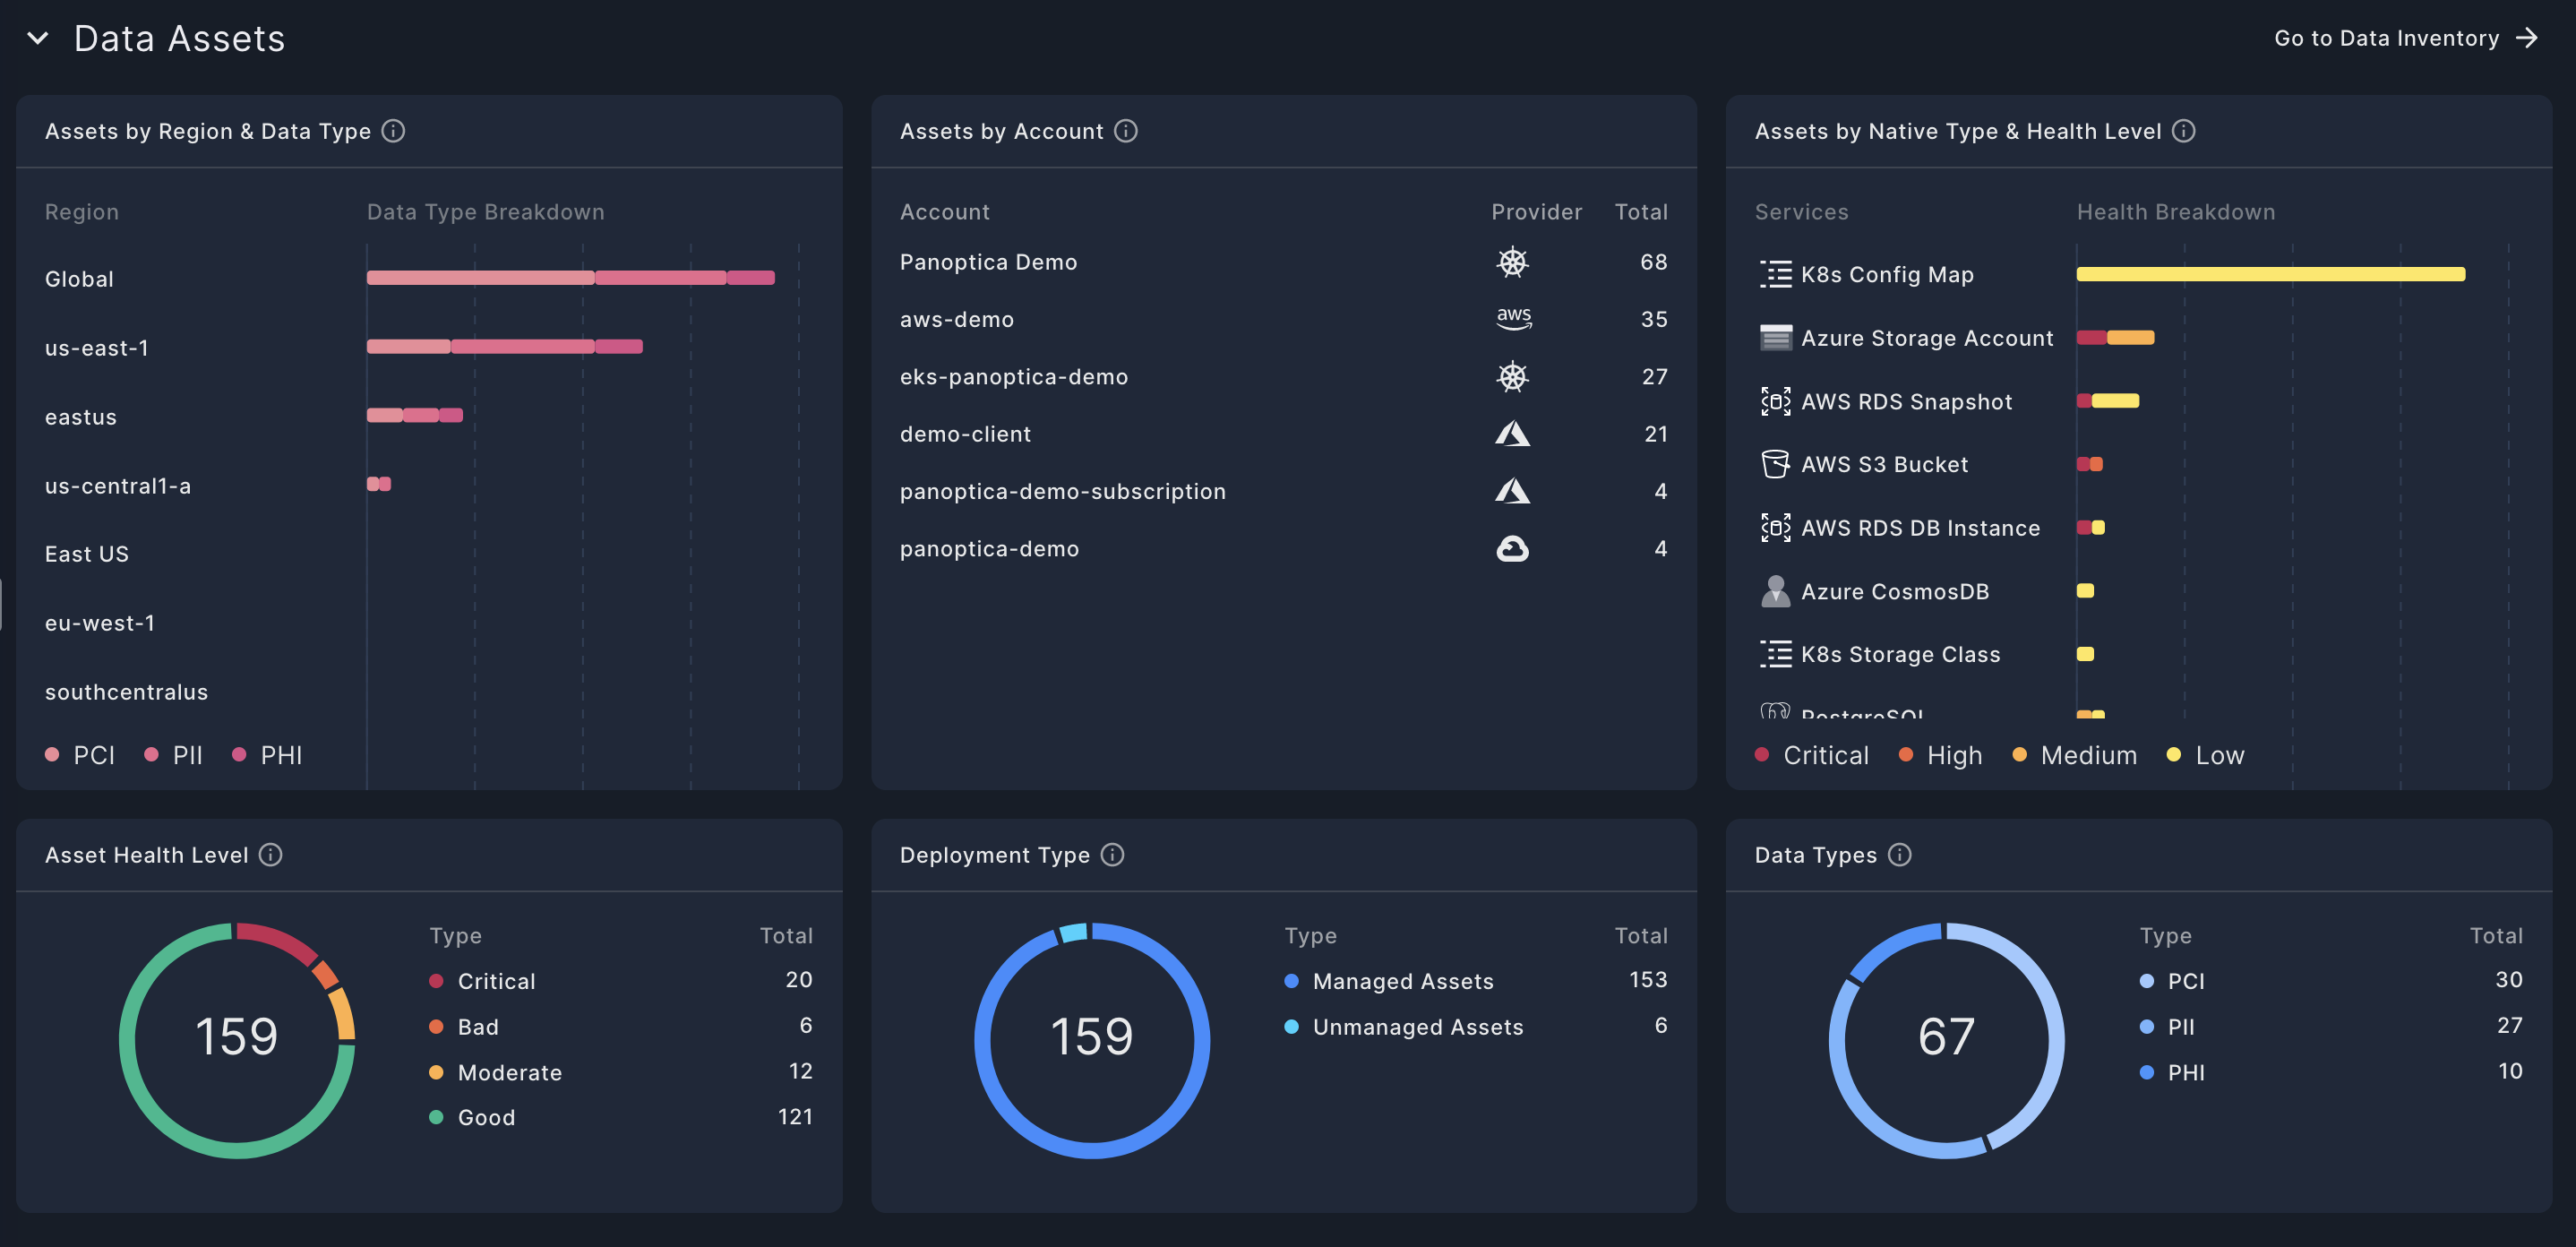
- Assets by Region & Data Type
This widget breaks down the data assets by region and data type and displays the aggregate data assets in that region. - Assets by Account
This widget displays the leading data assets discovered, listed by account and provider - Assets by Native Type & Health Level
This widget breaks down the data assets by service category and displays the aggregate health level of all the assets in that category. - Asset Health Level
This widget displays the data assets by their Health Level. See Asset Health Score for more information. - Deployment Type
This widget breaks down the data assets by deployment type. - Data Types
This widget displays the assets with data types identified, broken down by region. See Data Types and Classes for more information.
Click Go to Data Inventory → to view the Assets Inventory, where you can drill down to discover more details about the assets discovered. See Data Inventory for more details.
Data Security Posture Findings
The Data Findings dashboard displays widgets that provide snapshot views of the security findings, according to account, provider, category, and severity.
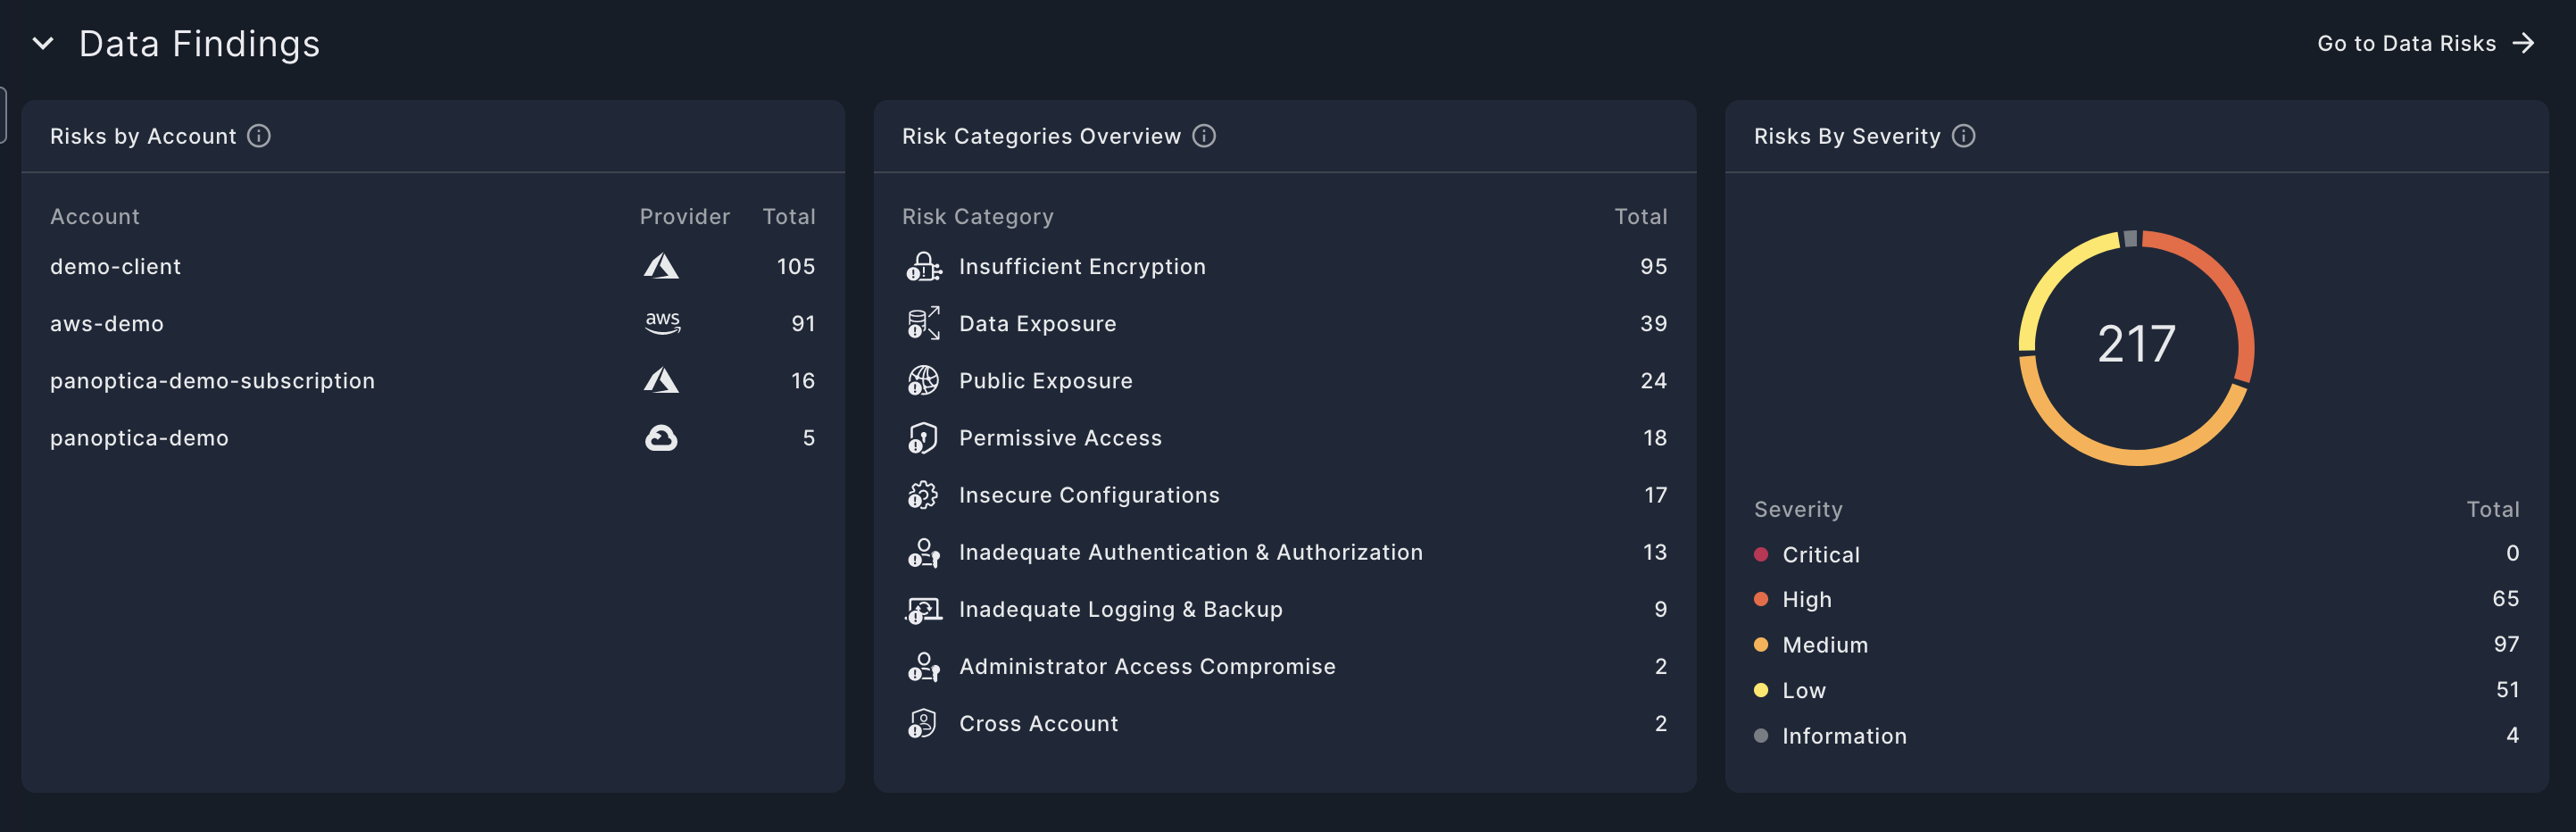
- Risks by Account
This widget breaks down of the leading risks, listed by account name and provider - Risks Categories Overview
This widget illustrates the distribution of detected risks across different risk categories. Each category's proportion is calculated based on the number of risks detected out of the total number of potential risks the system can detect in that category. It provides insight into which areas are most impacted by security issues and helps prioritize remediation efforts accordingly. See Risk Categories for more details. - Risks by Severity
This widget presents a breakdown of the number of risks detected according to their severity level: 'Critical', 'High', 'Medium', 'Low' or 'Information'.
Click Go to Data Risks → to view the Security Posture page, pre-filtered for Data Security risks. There you can delve deeper into the risks identified, discover related assets, and potentially learn how to remediate the risks.
Updated 8 months ago