Kubernetes Controller Onboarding
The Panoptica controller can be deployed in any Kubernetes cluster, including managed environments such as OpenShift and GKE. Once the controller is deployed, your cloud resources will gain all the benefits of Panoptica security: inventory scanning, attack path analysis, vulnerability management, root cause analysis, compliance, and more.
The controller deploys three key elements of Panoptica's security platform:
-
Kubernetes Security Posture Management (KSPM) continuously scans and protects your cloud workloads, identifying risks associated with misconfigurations and vulnerabilities.
-
Smart Cloud Detect and Response (CDR) enables K8s runtime protection, so you can discover live security events as they happen. In addition to monitoring the activity in realtime on the Smart CDR tab, Panoptica can also issue alerts via the platform of your choice, according to severity levels that you configure. See Notifications and Alerts for details on configuring notification channels and CDR alerts.
-
API Security collects and analyzes live API traffic, automatically building a catalog of the APIs in your environment, including the APIs you expose (internally and externally), as well as third-party APIs your applications consume. Along with trace source collectors, Panoptica's API Security controller analyzes risks and vulnerabilities, assigns risk scores, and helps maintain your security posture. See API Security for details.
Note that configuring Panoptica to secure your APIs is a two-step process. After deploying the API Security Controller in your cluster, you then need to attach the Trace Sources by deploying a plugin to your API gateway.
Panoptica enables implicit, automatic scalability as you grow the cluster to production scales.
Prerequisites for the cluster: KSPM + API Security
- Kubernetes 1.23 or later
- Helm version is 3.8.0 or higher, with OCI registry support
- At least three nodes in the cluster
- K8s CLI (kubectl) should be installed on the machine or VM from which the deployment is run, with admin permissions to the cluster
- The machine or VM that deploys the Panoptica chart must have access to
public.ecr.aws/ciscoeti/panoptica, in order to run the helm/cli commands- DNS resolution and external access to these domains, on port 443:
- Panoptica platform:
portshift.panoptica.app- Container Registry (if not using internal registry):
registry.outshift.com/panoptica- For US and global deployments:
us1.deploymentmanager.panoptica.appus1.k8s-integration.panoptica.appus1.k8s-integration-otel-collector.panoptica.app- For deployments in the EU:
eu1.deploymentmanager.panoptica.appeu1.k8s-integration.panoptica.appeu1.k8s-integration-otel-collector.panoptica.app- Resources required: 8 GB memory, 1.2 vCPU cores (total, for all nodes).
Prerequisites for Smart CDR
If you plan to include Smart CDR in the deployment, there are additional requirements:
- Kernel version 5.8 or higher
- Permission to create a PVC (Persistent Volume Claim)
- For each node in the cluster, additional 0.2 CPU cores and 0.5 GB memory
- 256 MB of additional memory for supporting services
- DNS resolution and external access to these additional domains, on port 443:
- For US and global deployments:
otel-collector.dragonfly-prod-1.prod.panoptica.appwheel.dragonfly-prod-1.prod.panoptica.appart.dragonfly-prod-1.prod.panoptica.app- For deployments in the EU
otel-collector.dragonfly-prod-euc-1.prod.panoptica.appwheel.dragonfly-prod-euc-1.prod.panoptica.appart.dragonfly-prod-euc-1.prod.panoptica.app
There are four ways you can integrate Panoptica's Kubernetes controller into your environment:
- Deploy using the Panoptica Console UI
- Deploy using command line interface (CLI)
- Deploy using our REST API
- Deploy using Terraform
All four methods use customized Helm charts to deploy and maintain the Panoptica controller in your cluster.
And all methods can be further customized with Helm values listed in Advanced Kubernetes Integration.
Accounts table
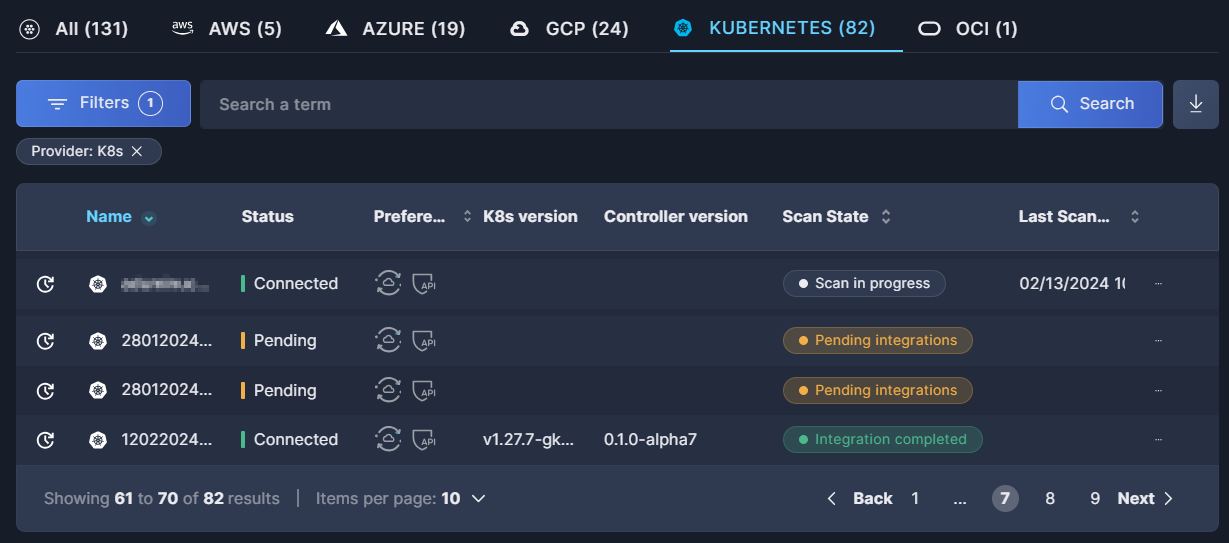
The controllers you have deployed in your cluster – either via the Console UI or via CLI – will be listed in the Kubernetes tab of the Accounts table.

For further details, see the documentation on the Accounts table.
Updated 5 months ago
