Kubernetes Onboarding using CLI
The Panoptica Kubernetes controller can be deployed in any K8s cluster. Once the controller is installed, your cloud resources are integrated with the Panoptica SaaS, providing you all the benefits of Panoptica security: inventory scanning, attack path analysis, vulnerability management, root cause analysis, compliance, and more.
The Panoptica K8s CLI enables you to manage this integration via command line interface. The CLI includes all the capabilities of Kubernetes Onboarding with Console UI – Kubernetes Security, API Security, and Smart CDR features – with greater control and scalability. The CLI utilizes the same Helm charts as the Console UI deployment, providing the flexibility to use whichever method you prefer, even interchangeably.
For more information – including prerequisites and feature details – please visit Kubernetes Controller Onboarding
Download the CLI
In order to deploy and manage the Kubernetes controller from a command line, you need to download the Panoptica K8s CLI, and you need to generate an API Key. To download the CLI, simply run this script, which will download the correct bundle for your operating system and architecture:
curl https://download.panoptica.app/cli/get_k8s_cli.sh | bash
Go ahead and explore the help menus for syntax and usage:
./panoptica-k8s --help
Generate API Key
To perform any action with Panoptica's K8s CLI, you need an API Key. To generate the key, log into the Panoptica platform and select Settings in the navigation pane, then the API Keys tab.
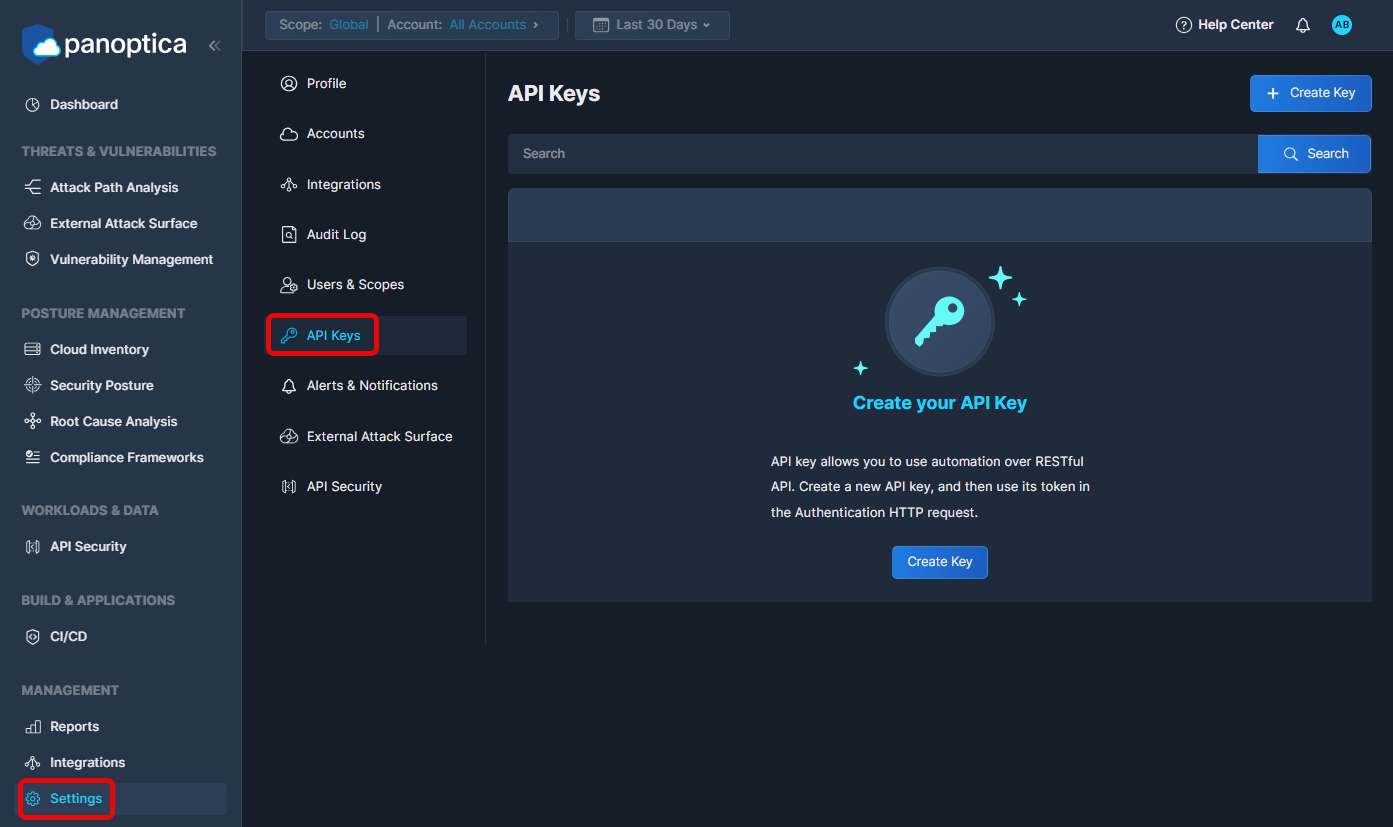
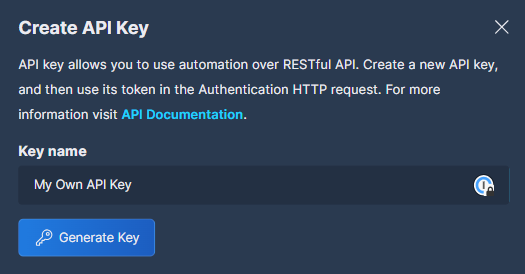
Click Create Key to open a popup overlay, where you can generate the key.
Permissions required
Users must have an Owner or Ops role in Panoptica to generate API Keys.
See User Management for details on User Roles
Enter a logical Key name, and click Generate Key.
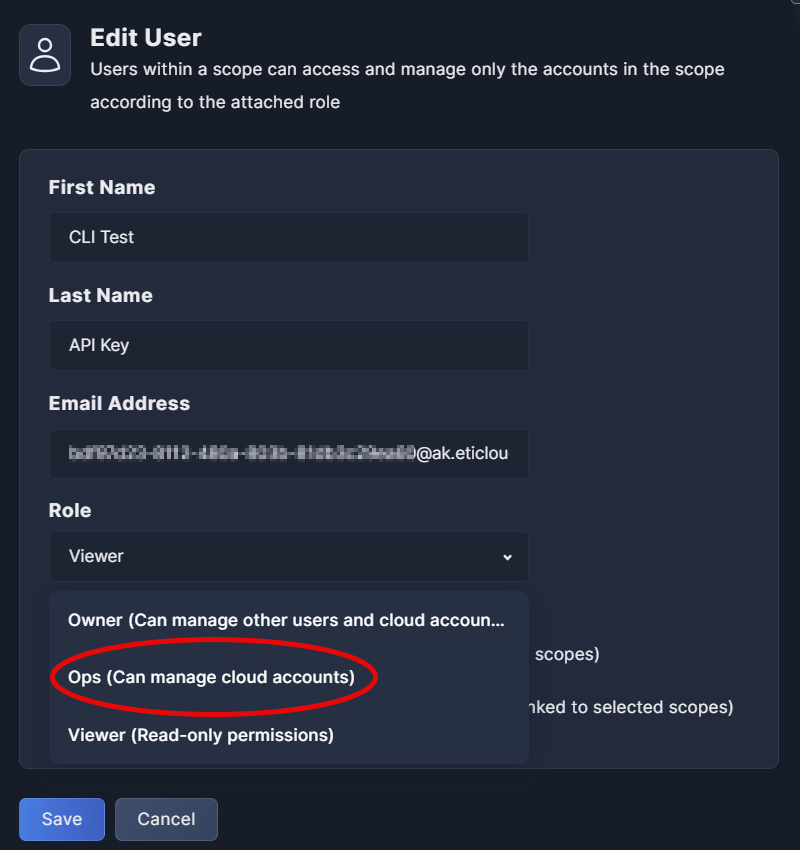
Promote API Key to Ops user
Once the API Key is created, go to the Users & Scopes tab and modify its role from Viewer to Ops. This will enable the key to create and modify Panoptica K8s integrations.
See User Management for details on User Roles
We recommend storing the API Key in a config file, along with the URL of your Panoptica tenant.
api.us1.console.panoptica.app- Default URL, for US and global customersapi.eu1.console.panoptica.app- For customers in the EU
./panoptica-k8s config init --api-key <API Key> --url api.us1.console.panoptica.app
CLI Commands
Now you're ready to start managing your Kubernetes integrations using the Panoptica CLI.
There are two sides to the integration: configuration in Panoptica, and deployment in your cluster. When you create a new integration in the Panoptica platform, you also need to install the controller in your cluster. Similarly when you update the configuration on the platform, you also need to upgrade the installation in your cluster. And when you delete the cluster in Panoptica, you uninstall the controller from your cluster.
The controller can deploy three key elements of Panoptica's security platform:
- KSPM (Kubernetes Security) – KSPM is always enabled.
- Smart CDR – CLI flag:
--cdr-enabled
See Smart CDR for details. - API Security – CLI flag:
--apisec-enabled
See API Security for details.
Cluster permissions
Note that Admin permissions are required to install and manage the controller in your cluster.
Listed here are a few examples of the most common actions, to get you started.
To discover more commands, or learn more about any specific command, just call the CLI help command:
./panoptica-k8s --help
Releases
To list the releases of the Panoptica integration:
./panoptica-k8s release get
Integrations
-
To retrieve a list of all the integrations:
./panoptica-k8s integration get -
To retrieve a specific integration in a JSON format:
./panoptica-k8s integration get <integration name> -o json
Verify prerequisites
This command runs a test in your K8s environment to make sure it fits the list of prerequisites in Kubernetes Controller Onboarding
- To check your environment's compatibility before installing the controller:
Add./panoptica-k8s integration verify-prerequisites <integration-name>-vto enable verbose mode, and receive more details during the verification tests.
Install
-
To create a new integration in the Panoptica SaaS, and deploy it. This example deploys KSPM, API Security, and Smart CDR. Use -w to wait for installation to complete, or run installation in the background.
./panoptica-k8s integration install --create "my_k8s_cluster" --kspm-enabled --apisec-enabled --cdr-enabled -w
Update/Upgrade
-
To update the configuration an existing integration, without upgrading the integration in the cluster:
./panoptica-k8s integration update <integration name> --cdr-enabled=falseThis example – which disables Smart CDR – will result in the configuration in the Panoptica SaaS being out of sync with your cluster. You will need to update the installation in the cluster to ensure the selected features are active.
-
To update an existing integration, and upgrade the installation in your cluster:
./panoptica-k8s integration upgrade --update --apisec-enabled=falseThis example disables API Security, which was initially deployed in the
createcommand above. -
To upgrade to the latest release version in the Panoptica SaaS, and in your cluster:
./panoptica-k8s integration upgrade --update --latest-release
Helm values
This command retrieves the values for a specific release of the Panoptica integration, which does not necessarily have to be the one currently configured or installed. This can be useful in a GitOps process, such as Argo CD, where the values may be managed separately. You can specify both a release version and a release ID, which can be obtained separately using the panoptica-k8s releases get command listed above.
- To get Helm values for an integration
./panoptica-k8s integration helm-values <integration-name> - To get Helm values for a specific release ID
./panoptica-k8s integration helm-values <integration-name> --release 32b91b6a-cac4-4c1e-b397-3bc251b352ce - To get Helm values for a specific release chart version
./panoptica-k8s integration helm-values <integration-name> --release 1.4.0 - To get the latest Helm values for an integration
./panoptica-k8s integration helm-values <integration-name> --latest-release
Uninstall
- To delete and uninstall an existing integration. This command will uninstall the currently-installed integration from your cluster, and delete it from the Panoptica SaaS:
./panoptica-k8s integration uninstall --delete
One at a time, please
If you plan to re-deploy the Panoptica controller to the same cluster, you must wait for the deletion to complete before restarting the process.
It might be better to consider editing and/or upgrading the deployment, rather than deleting and reinstalling.
Advanced settings
You can further customize the controller deployment using the Helm chart values listed at Advanced Kubernetes Integration.
First retrieve the Helm command for an existing integration:
./panoptica-k8s integration install-command <integration name>
Then customize the returned Helm command to specify additional configurations. For example, if you are installing the Panoptica controller in a RedHat OpenShift cluster, append the following string to the Helm command:
--set global.isOpenShift=true
And if your containers are larger than 2GB, you need to raise the scanner memory limit by adding this setting to the Helm command. In this example, the memory is set to 5GB; adjust the parameter as needed.
--set k8sec-controller.imageAnalysis.sbom.resources.limits.memory=5000Mi
API Trace Sources
If you enabled API Security in your deployment, you need to configure Trace Sources to gain visibility into API traffic across your workloads—as well as to/from external sources. This is done by deploying a plugin to an API gateway, which communicates with the Panoptica controller deployed on the cluster.
Navigate to the API Security tab in the Settings pane, and click API Trace Sources to configure these plugins.
See API Trace Sources for details.
Troubleshooting
If you encounter any issues deploying the Panoptica K8s controller, use the diagnostic command to gather relevant information from your cluster:
./panoptica-k8s integration diagnostic
The diagnostic command gathers metrics in five areas, and compresses it into a tarball:
- Specs of Panoptica pods, in JSON format
- Logs from Panoptica pods
- K8s API server events
- Nodes metrics (CPU and memory)
- Pods metrics (CPU and memory)
The collection and storage of diagnostic metrics can be customized with a number of flags. Run the help command for complete details: panoptica-k8s integration diagnostic --help.
Accounts table
Once the controller has been deployed in your cluster, it will be listed in the Kubernetes tab of the Accounts table.
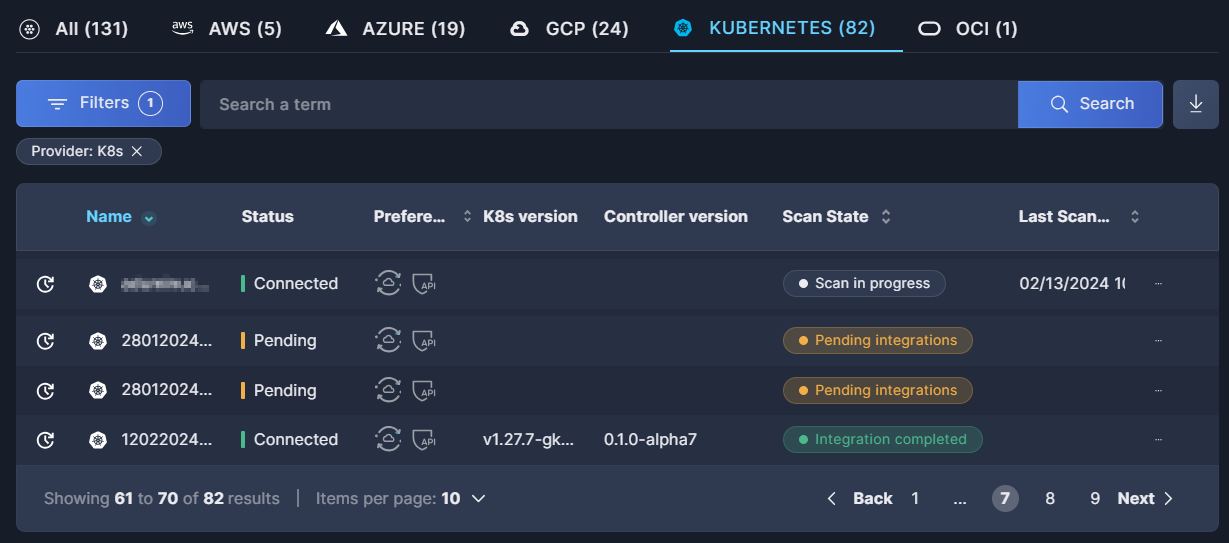
See our documentation on the Accounts table for further details,.
Updated 10 months ago