Checkmarx Integration
Panoptica's Checkmarx integration enables you to connect your code findings in Checkmarx with Panoptica's cloud data to enhance the security of your CI/CD pipeline.
Feeding the security data of your container images from Panoptica into Checkmarx One provides a number of benefits:
- Automate security scans during the build and deployment phases.
- Leverage Checkmarx One's capabilities for comprehensive security analysis and reporting.
- Proactively identify and mitigate vulnerabilities in container images before deployment.
To configure the integration, you first need to retrieve a few parameters from your Checkmarx account, then load them into Panoptica's console UI. Once connected, data from your Panoptica scans will appear in your Checkmarx Cloud Insights dashboard.
Retrieve Checkmarx Details
Log into your Checkmarx account to generate an API Key, which you'll need to configure the integration with Panoptica.
- Log in to the Checkmarx One web portal and select Settings, then Identity and Access Management.
- In the IAM portal, click API Keys, then click on the Create Key button.
- Adjust the API Key configuration, if you so desire.
- Click Create. The API Key is created and a window opens showing the key.
- Copy the key and save it in a safe place.
Don't forget to copy the key
Be sure to copy the API Key before you close the window.
Afterwards, you will not be able to retrieve the key.
See Creating API Keys in Checkmarx's documentation for details.
Integration with Panoptica
Once you have the requisite details, you're ready to configure the Checkmarx integration via Panoptica's Settings page:
-
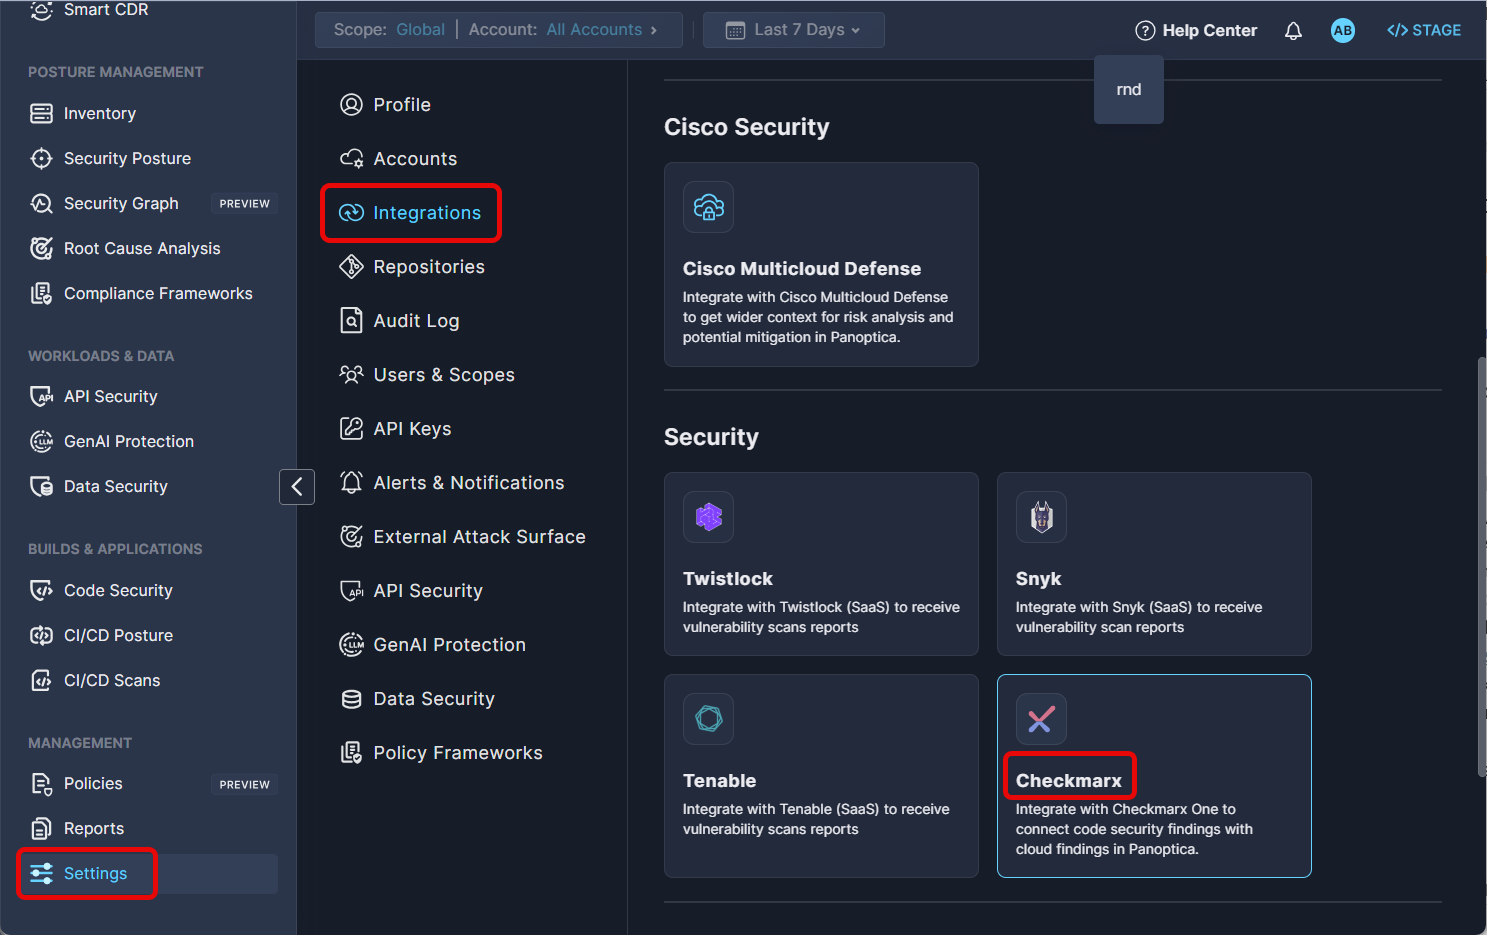
Click Settings in Panoptica's main navigation pane, then select Integrations.
-
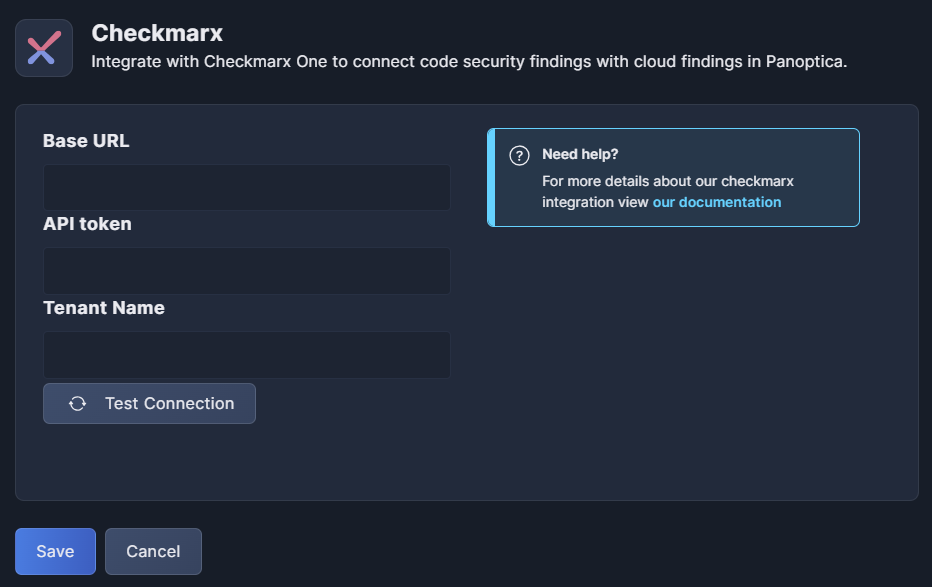
Select Checkmarx in the Security section to open the configuration screen.
-
Enter the Base URL of your Checkmarx account.
-
Enter the API Token you generated in the Checkmarx web portal (above).
-
Enter the Tenant Name of your Checkmarx project.
-
Click Test Connection to make sure everything is in order.
-
Don't forget to click Save.
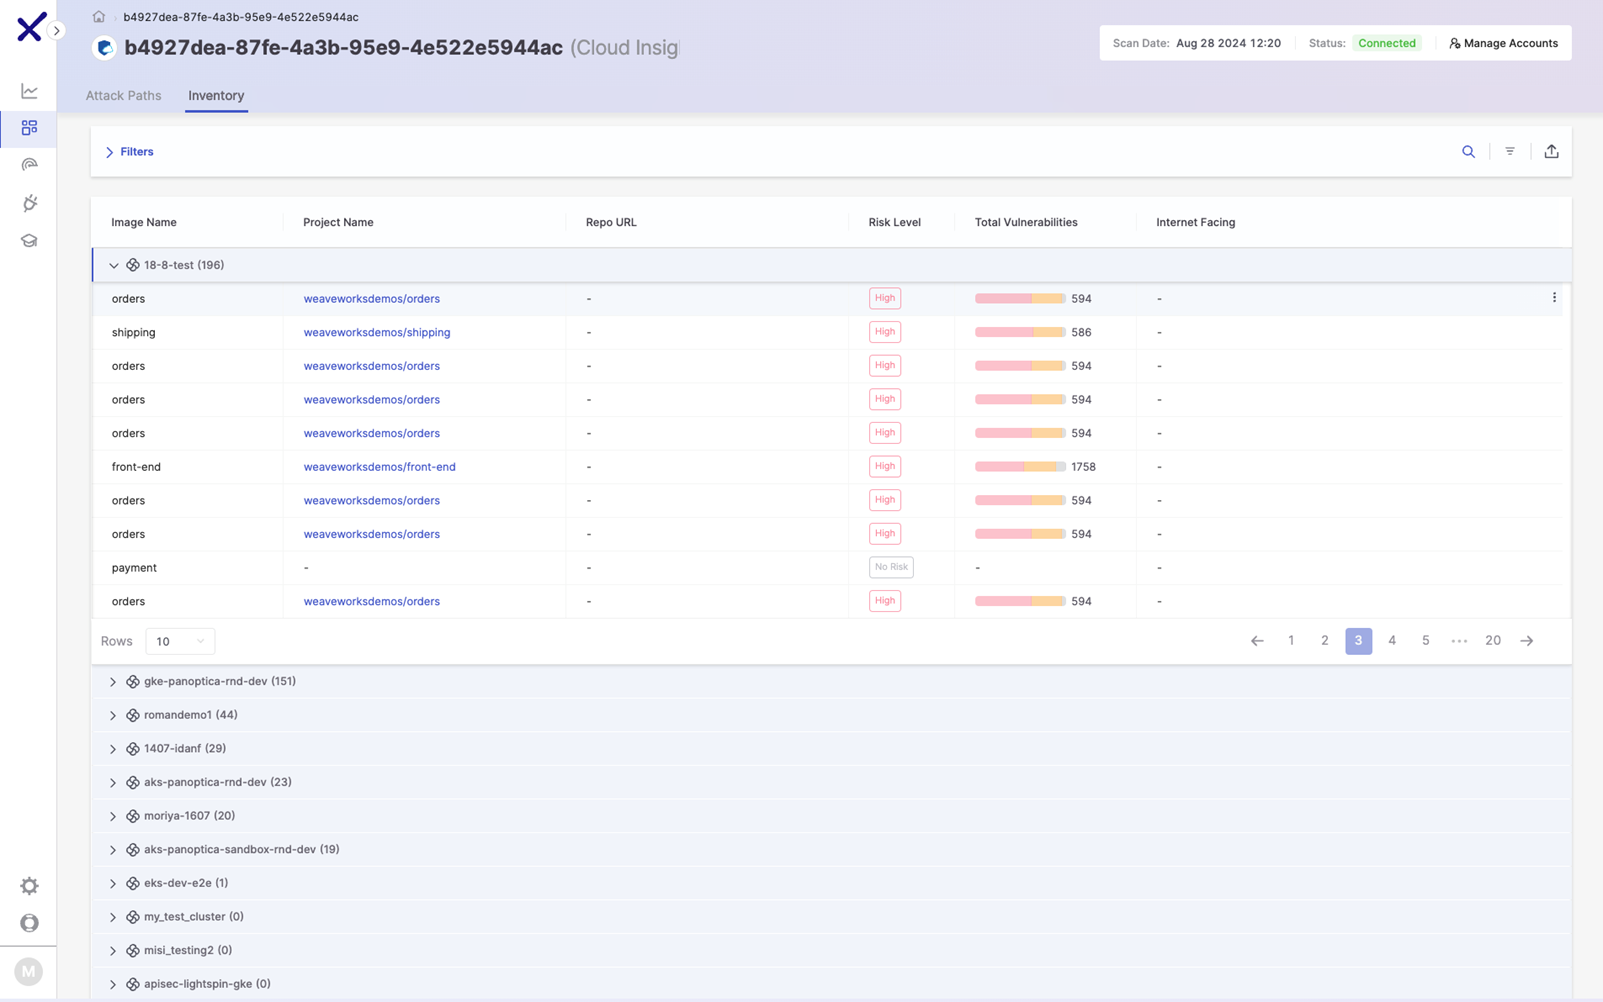
Once the integration is defined in Panoptica, it will appear under Cloud Insights in your Cloudmarx One dashboard. The status will display as "Pending" initially, until the results begin to appear.
After a minute or two, Checkmarx will generate a list of clusters and containers discovered by Panoptica, and display it in the Cloud Insights inventory. Expand an image name to view its repositories, with snapshot views of risk level, vulnerabilities, and exposure.
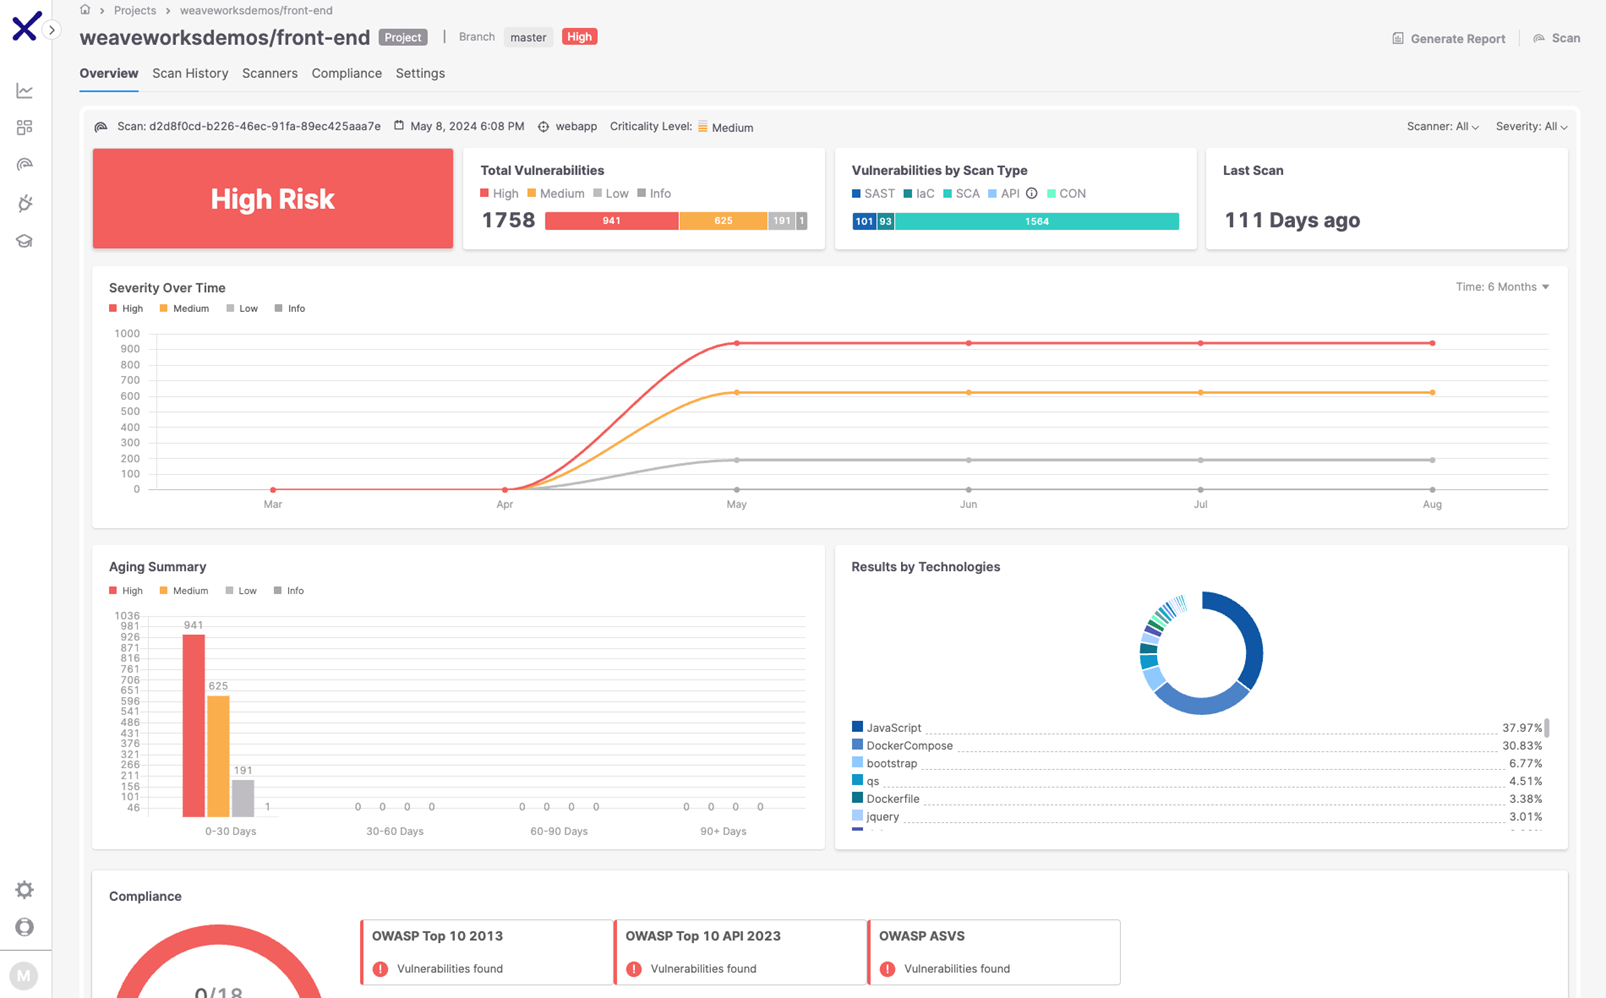
Click on a project name to view a graphical dashboard with more insights into the security status of that repository.
Panoptica data is refreshed once a day in Checkmarx.
Updated 7 months ago