Vulnerability Management
Common Vulnerabilities and Exposures (CVEs) in your environment can greatly increase risks to your business. Panoptica's Vulnerability Management solution takes the vulnerabilities found during our workload scans, and filters them through our prioritization engine—giving you the context you need to understand and prioritize the most urgent threats to your resources.
Panoptica's agentless scanning process takes snapshots of running instances and container images, and mounts those snapshots to scan them for CVEs and malware. Panoptica also integrates findings from a range of scanning tools and threat intelligence feeds, providing the same level of prioritization on both sets, thanks to our graph-based technology. For more information on the third-party tools Panoptica employs to provide better scoring of the CVEs discovered, as well as the process of prioritizing the most potentially impactful CVEs, see CVE Scoring and Prioritization.
Go to the Vulnerability Management tab under Threats & Vulnerabilities in the Panoptica console UI to view all the CVEs Panoptica has identified in your environment.
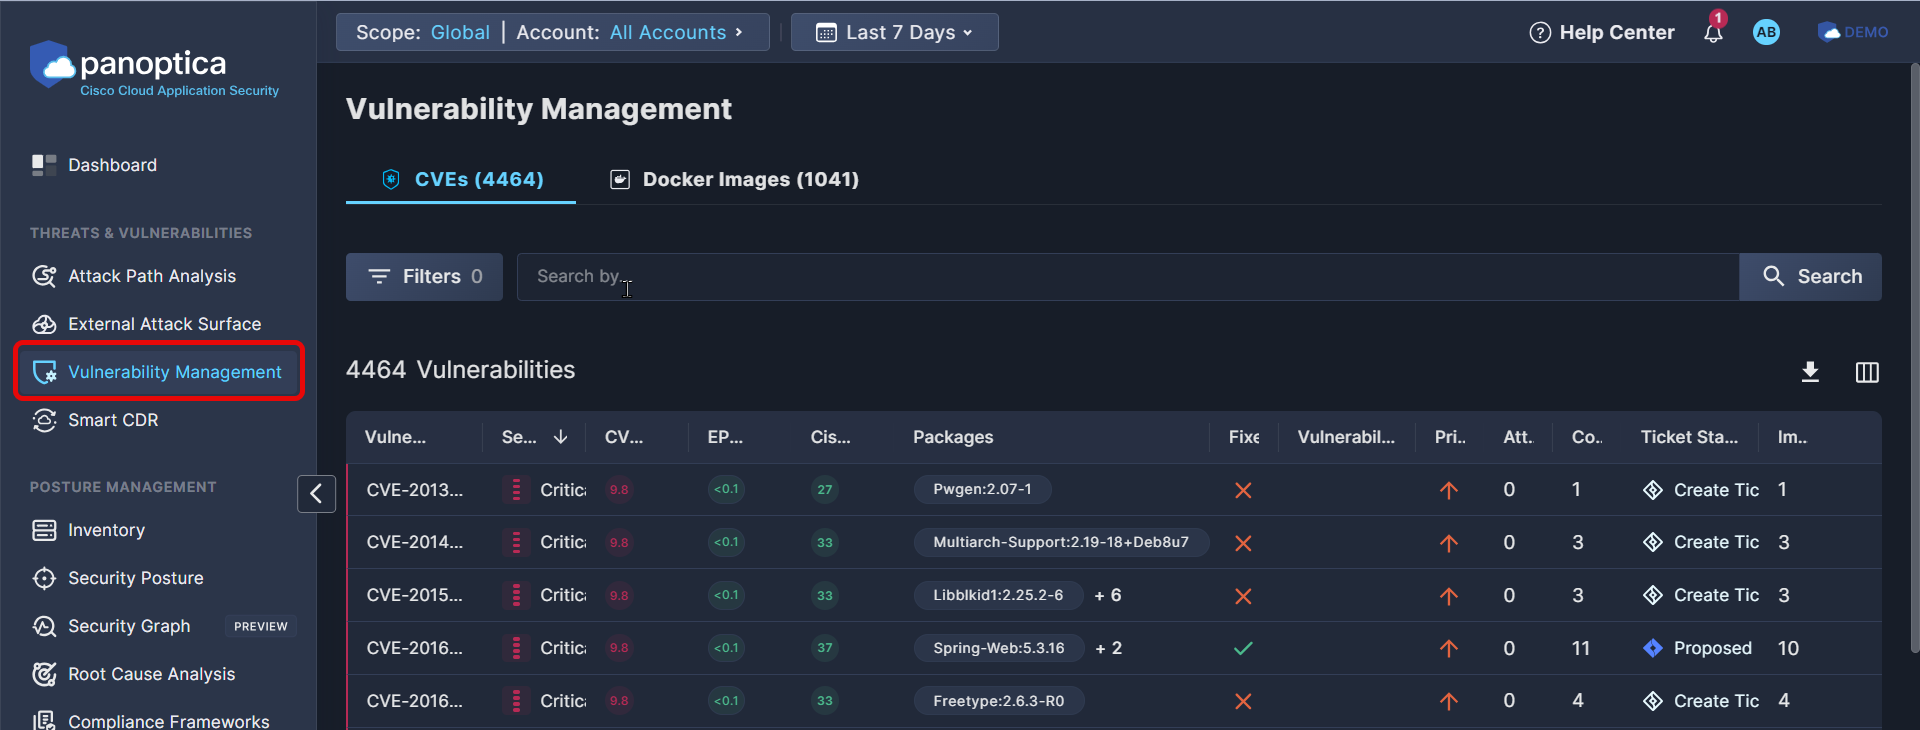
The CVEs tab lists all the CVEs Panoptica has identified in your environment, by Vulnerability ID.
The Docker Images tab displays the same CVEs, grouped by the docker images in which they were found.
CVEs Tab
The default view of Vulnerability Management, the CVEs tab provides visibility into all the vulnerabilities Panoptica has identified in your environment. You can filter and sort the table, open and manage Jira tasks, and drill down for more details.
Filter and Search
Use the Top Bar Filter to refine results across the platform by Scope and Account. You can also select the time frame you wish to focus on, from "Last 24 Hours" to "Last Month".

You can further refine the results using predefined filters and open search.
- Use the drop-down Filters option to narrow the results by these parameters:
- Asset Name
- Source Type
- Severity
- Risks
- Asset Risks (Sensitive)
- Prioritized
- Attack Path
- Fixable Packages
- Use the Search bar to look for free text from a CVE's Vulnerability ID, Package name, Package version, or Asset name.
Vulnerabilities Table
The Vulnerabilities table lists all the CVEs Panoptica has found in your environment, filtered according to your settings. The table can be sorted by most of its columns.
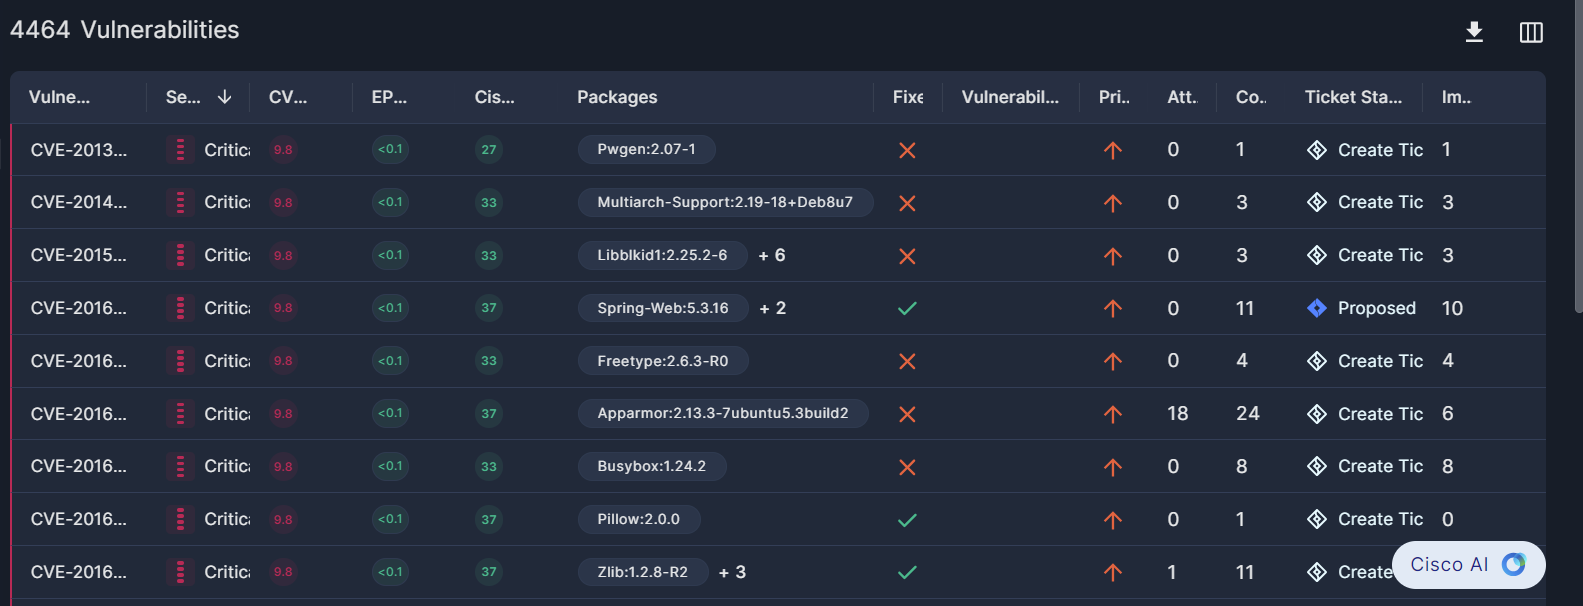
Vulnerability ID: the unique CVE identifier, or any other alias ID when the CVE ID is not available, such as GHSA, ALEA, etc.
Severity: Critical, High, Medium, Low, or Informational
CVSS Score: the standardized Common Vulnerability Scoring System score, on a scale from 0 to 10.
EPSS: Cisco's "Exploit Prediction Scoring System" (EPSS) estimates the probability that a vulnerability will be exploited in the wild in the next 30 days, on a scale from 0 to 100%.
See EPSS and Its Role in Cisco Vulnerability Management Risk Scoring for details.
Cisco Security Risk Score: Cisco Vulnerability Management is a risk-based vulnerability management solution that uses data science and machine learning algorithms to assign a dynamic real-time security score to vulnerabilities, displayed on a scale from 0 to 100.
Packages: the package where the CVE was found in your resources, with the version.
Fixes: whether there is a known fix available.
Vulnerability risks: icons indicating three possible risks: Publicly exposed, Exploitable, and/or CISA threat trends
Prioritized: whether the CVE is prioritized or not
Attack Path: the number of attack paths in which the CVE appears.
Compute Assets: the number of compute assets in which the CVE appears.
Ticket Status: Click Create Ticket to open a task in Atlassian Jira. If a task has already been created, click the link in the Ticket Status column to view the ticket in Jira in a new browser tab. See JIRA Integration for more information.
Images: the number of Docker images in which the CVE appears.
Click the down arrow (↓) in the upper right corner of the table to Download the list of CVEs in the table in CSV format, with or without asset information.
Select which columns are displayed by clicking the Columns button (▥) beside the Download button.
You can define how many results are displayed on a page, from 15 to 200 rows.
CVE Details
Click on any row in the table to pop up additional information about that vulnerability in a side drawer.
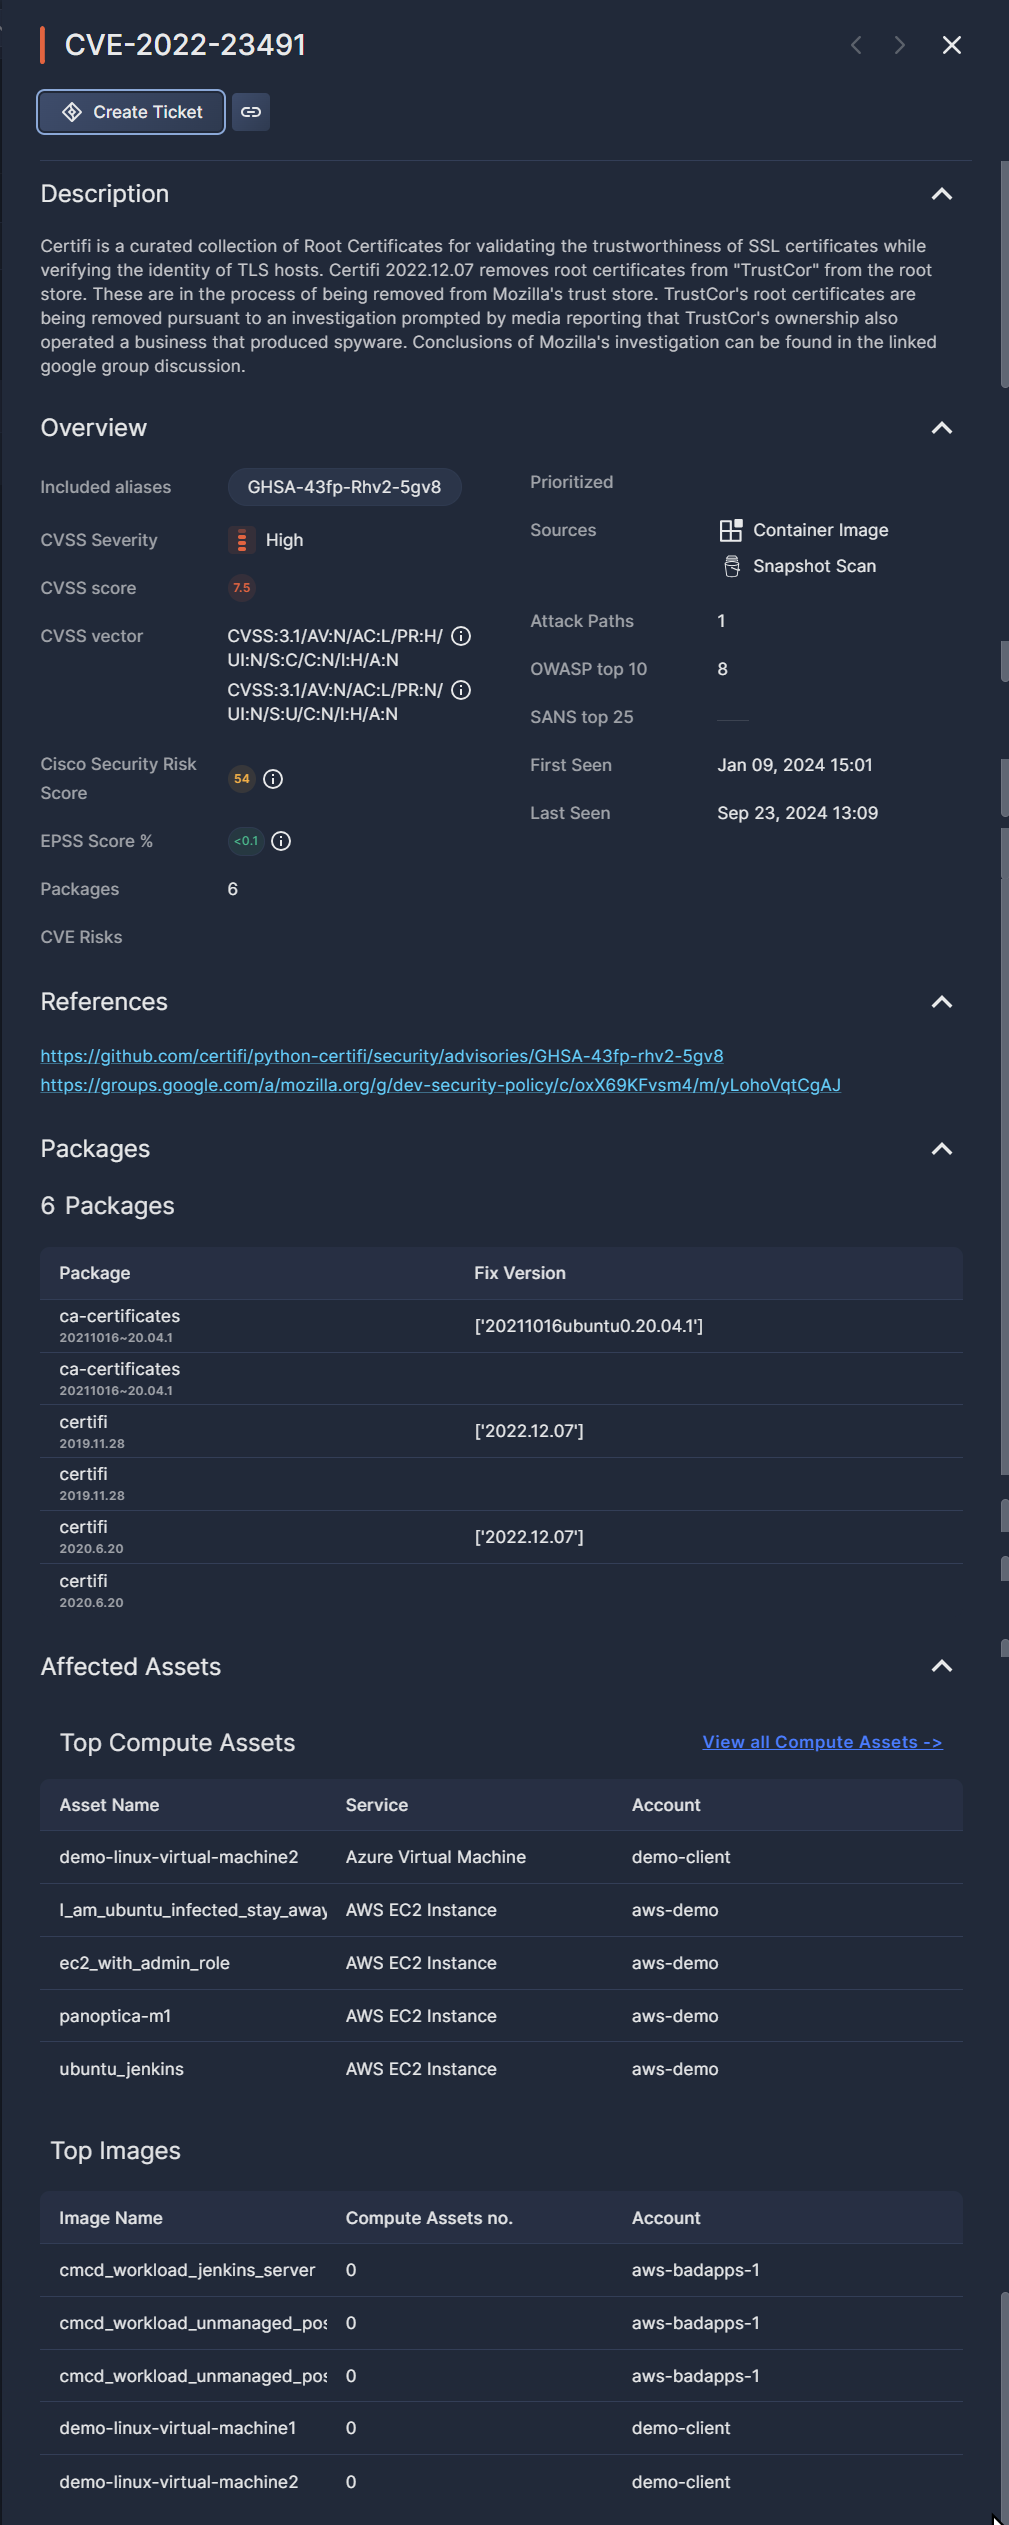
The buttons at the top of the side drawer enable specific actions on that asset:
- Click Create Ticket to open a task in Atlassian Jira to address this CVE. If a task has already been created, click the status link to view the ticket in Jira in a new browser tab. See JIRA Integration for more information.
- Click Copy Link to retrieve a URL of the asset page
Description
A detailed explanation of the vulnerability's traits, how it is implemented, and what risks it entails.
Overview
The side drawer displays all of the summary data available in the Vulnerabilities table, plus a whole lot more.
Included aliases: any other available IDs used for this vulnerability.
CVSS vector: a list of all vectors available, powered by NIST. Hover over the info icon (i) to view more details.
Cisco Security Risk Score: a predictive model that calculates risk scores based on both internal and external variables. Formerly known as Kenna.vm, Cisco Vulnerability Management helps Cisco customers with an SBG hybrid suite license prioritize their remediation efforts.
EPSS: Cisco's "Exploit Prediction Scoring System" (EPSS) estimates the probability that a vulnerability will be exploited in the wild in the next 30 days, on a scale from 0 to 100%.
See EPSS and Its Role in Cisco Vulnerability Management Risk Scoring for details.
CVE Risks: indicates whether the vulnerability includes any of three possible risks: Publicly Exposed, Exploitable, and/or a CISA top CVE. If CISA is listed, hover over the info icon (i) for more details.
Sources: where the vulnerability was found, such as EC2 Snapshot, Container Image, etc.
OWASP top 10: the OWASP ranking, when available.
SANS top 25: the SANS ranking, when available.
First seen: the first time it was observed in your environment
Last seen: when it was most recently observed in your environment
References
A list of public resources related to the selected vulnerability. Click the links to learn more about this CVE.
Packages
A list of packages where the CVE was found in your resources, along with the version.
If there is a fix in a newer version, that is listed under Fix Version.
Affected Assets
Under Top Compute Assets, you'll find up to five assets that could be affected by this vulnerability. In addition to the Asset Name, the table also lists the Service and the Account where the asset is located.
Under Top Images, you'll find up to five images that could be affected by this vulnerability. In addition to the Image Name, the table also displays the number of compute assets in the image and the account where it's located.
Docker Images Tab
Select the Docker Images tab to display the same CVEs, grouped by the docker images in which they were found. This enables you to explore specific images, view the breakdown of any vulnerabilities discovered, and take action on the image level.
Filter and Search
Just as in the CVEs tab, use the Top Bar Filter to refine results across the platform by Scope and Account. You can also select the time frame you wish to focus on, from "Last 24 Hours" to "Last Month".
You can further refine the results on the Docker Images tab using predefined filters and open search.
- Use the drop-down Filters option to narrow the results by these parameters:
- CVE Source
- CVSS Severity
- CVE Risks
- Asset Risks
- Prioritized
- Use the Search bar to look for free text in a CVE ID or Image name.
Docker Images Table
The Docker Images table displays a list of all the images Panoptica has discovered in your environment, with summary data and a graphical representation of the number and severity of the vulnerabilities found within.
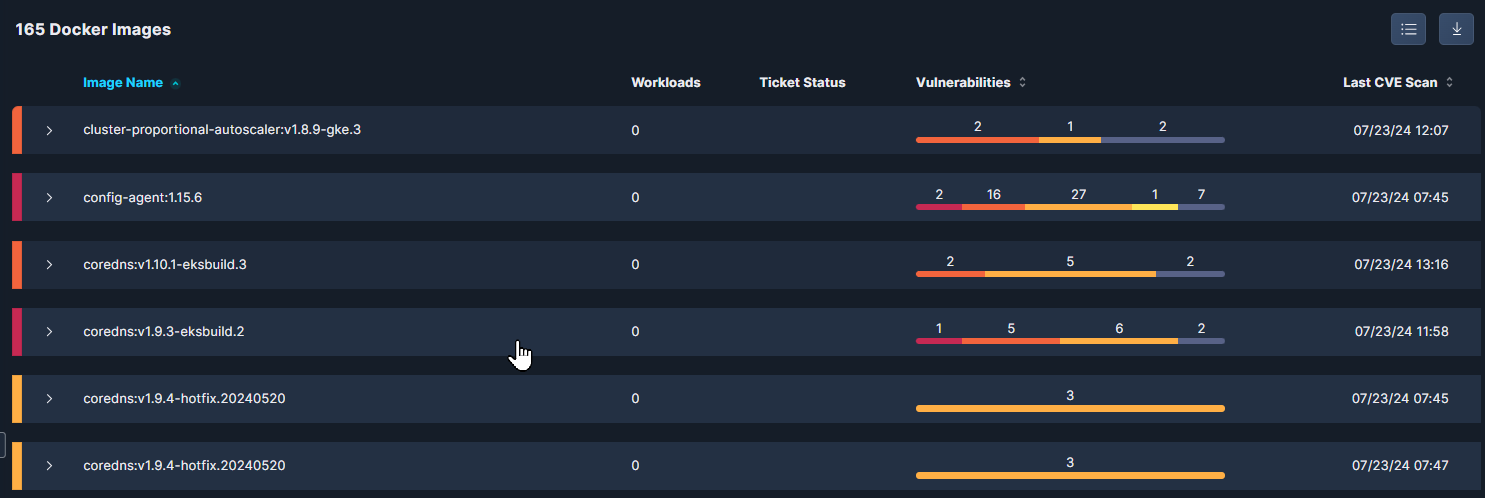
Image Name: the name of the docker image. The table can be sorted alphabetically by this field.
Workloads: the number of workloads found in this image.
Ticket Status: the status of any Jira or ServiceNow tickets opened.
Vulnerabilities: a bar graph indicating the number of Critical, High, Medium, Low, and Informational CVEs. The table can be sorted by this field.
Last CVE Scan: when the image was most recently observed in your environment. The table can be sorted chronologically by this field.
Expand any row to view a detailed list of the vulnerabilities discovered in the selected image, with summary data about each CVE. The table can be sorted by each of the sub-headers.
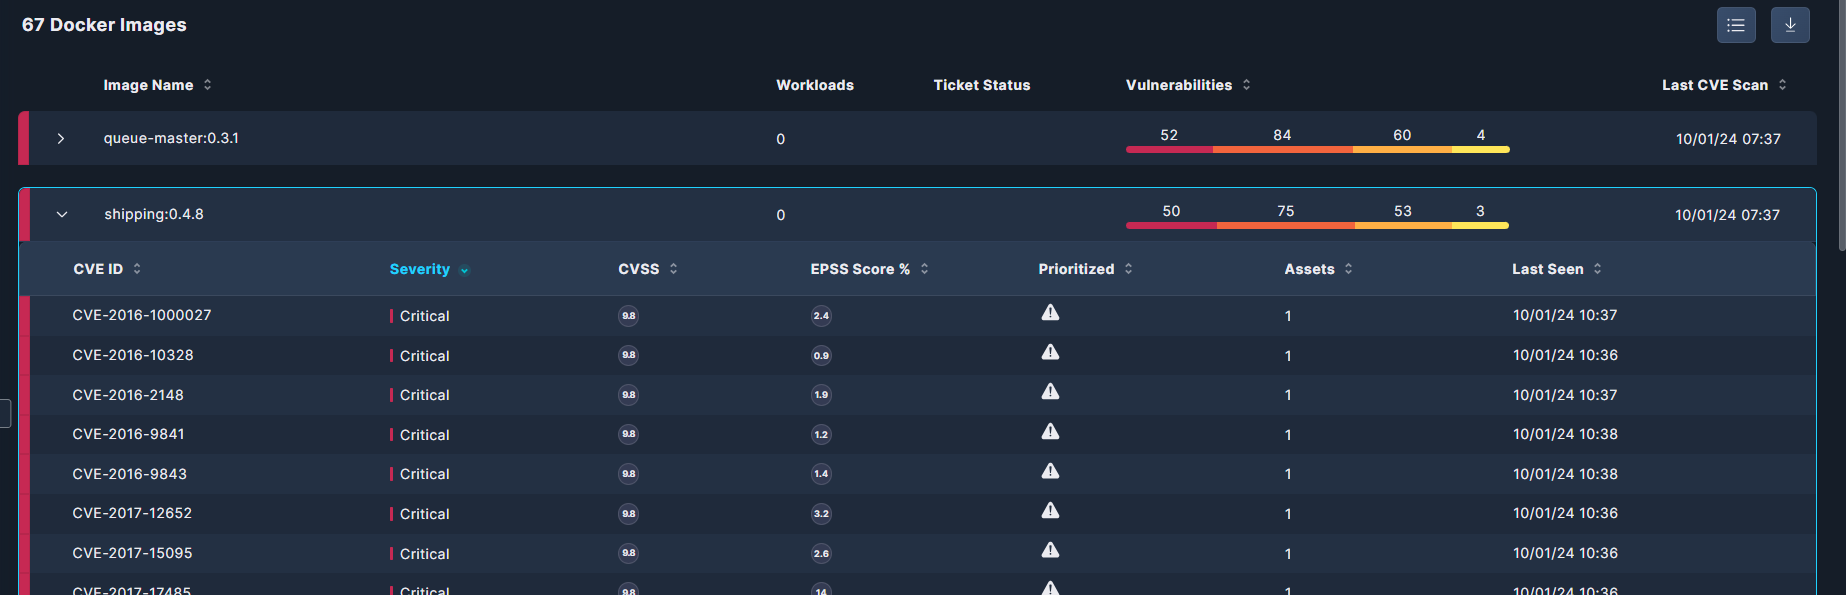
CVE ID: the unique CVE identifier.
Severity: Critical, High, Medium, Low, or Informational.
CVSS: The standardized Common Vulnerability Scoring System score, on a scale from 0 to 10.
EPSS: Cisco's "Exploit Prediction Scoring System" (EPSS) estimates the probability that a vulnerability will be exploited in the wild in the next 30 days, on a scale from 0 to 100%.
Prioritized: whether the CVE is prioritized or not
Assets: the number of compute assets in which the CVE appears.
Last Seen: when the CVE was most recently observed in your environment.
Select which columns are displayed by clicking the Columns button, in the upper right corner of the table.
Click the down arrow <↓> beside the Columns button to download the list of assets in JSON or CSV format.
You can define how many results are displayed on a page, from 10 to 200 rows.
Updated 4 months ago